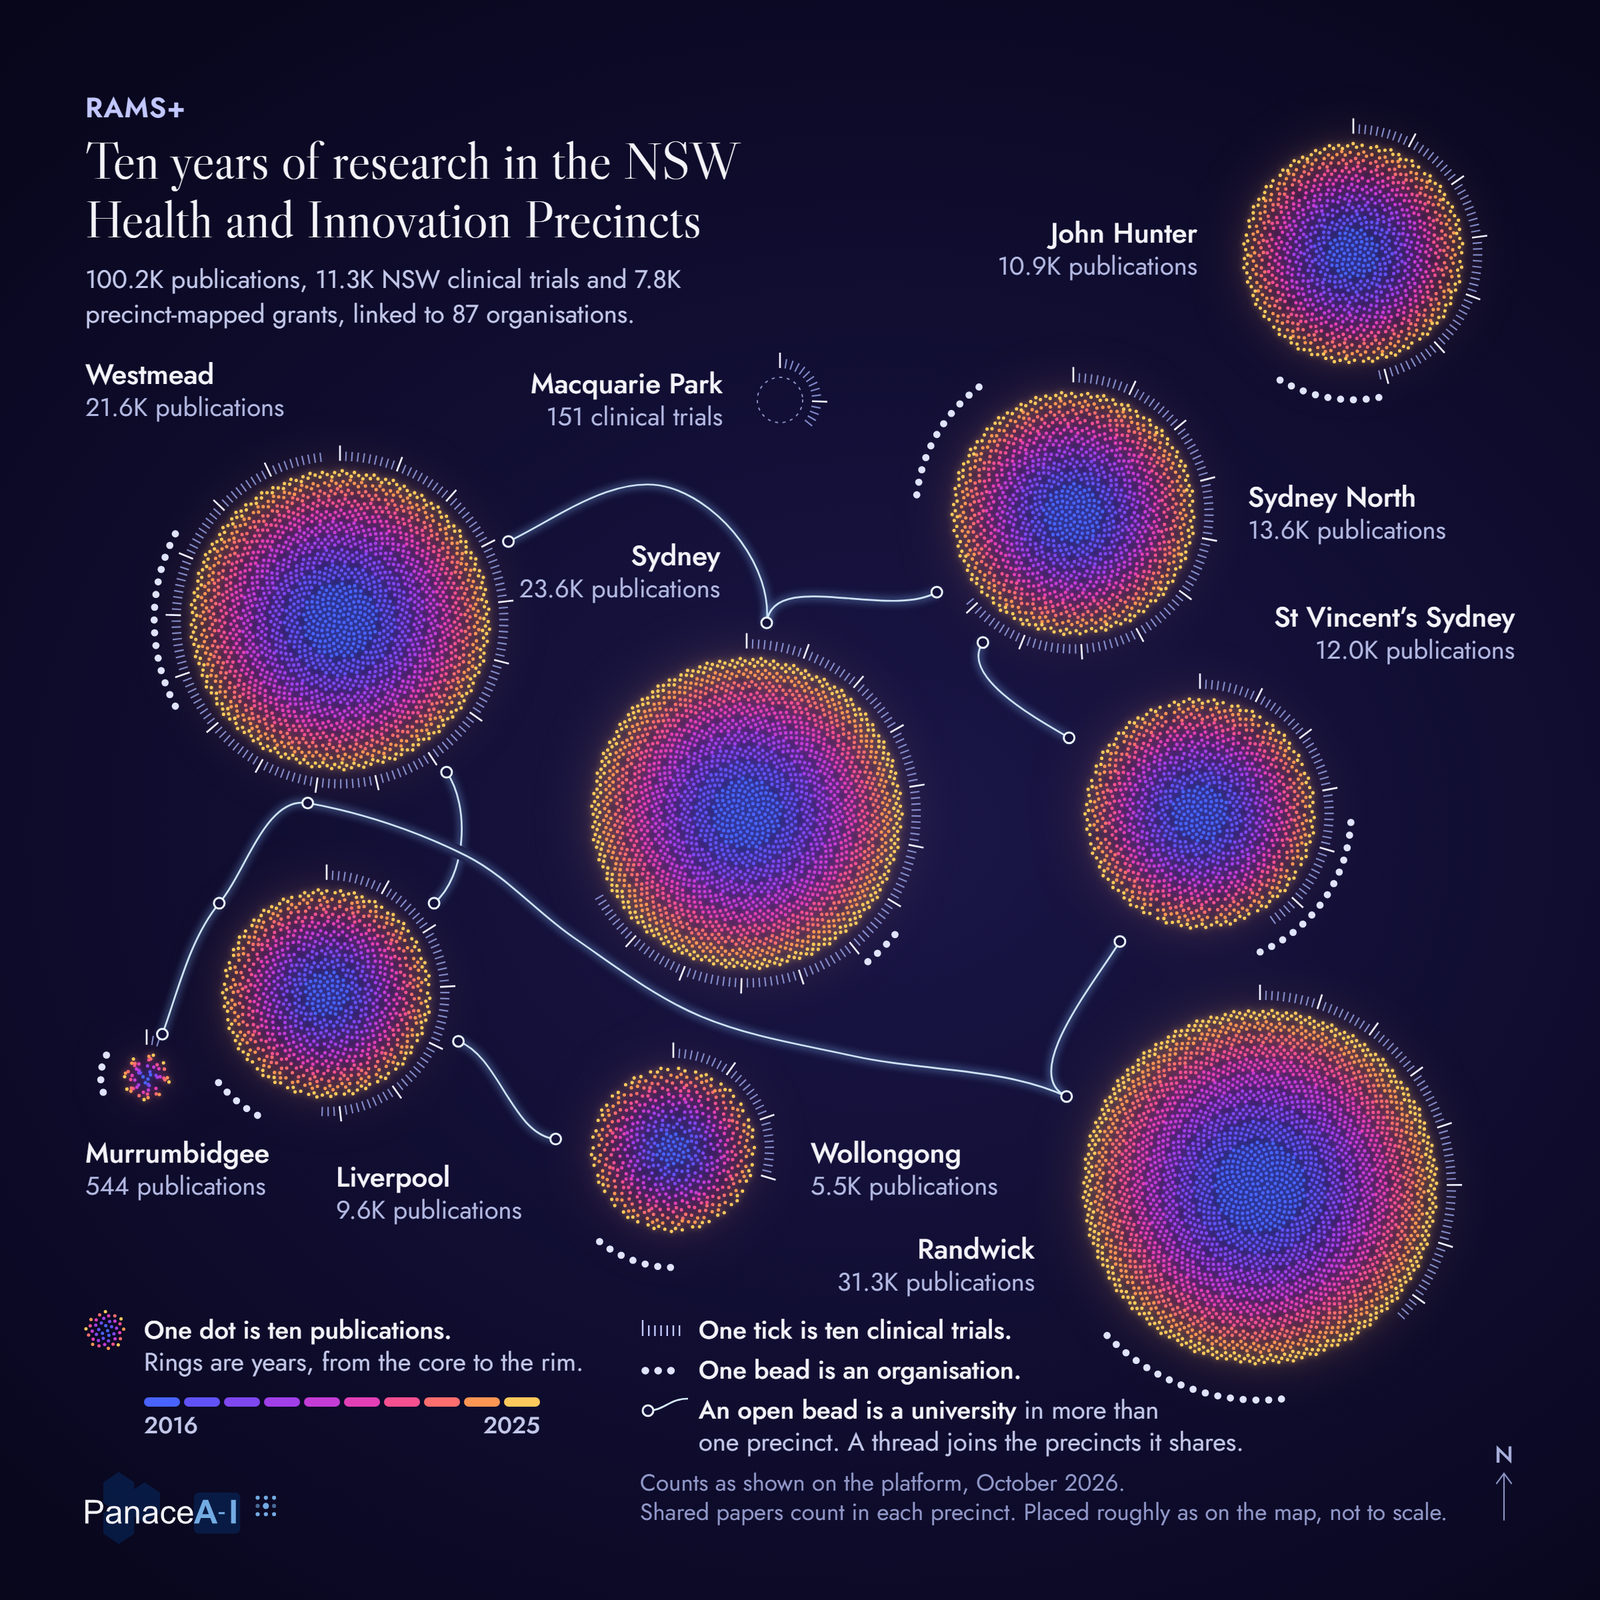
Discs of small dots, one for each NSW health precinct, ringed by year from blue at the core to gold at the rim, with fine threads between them.
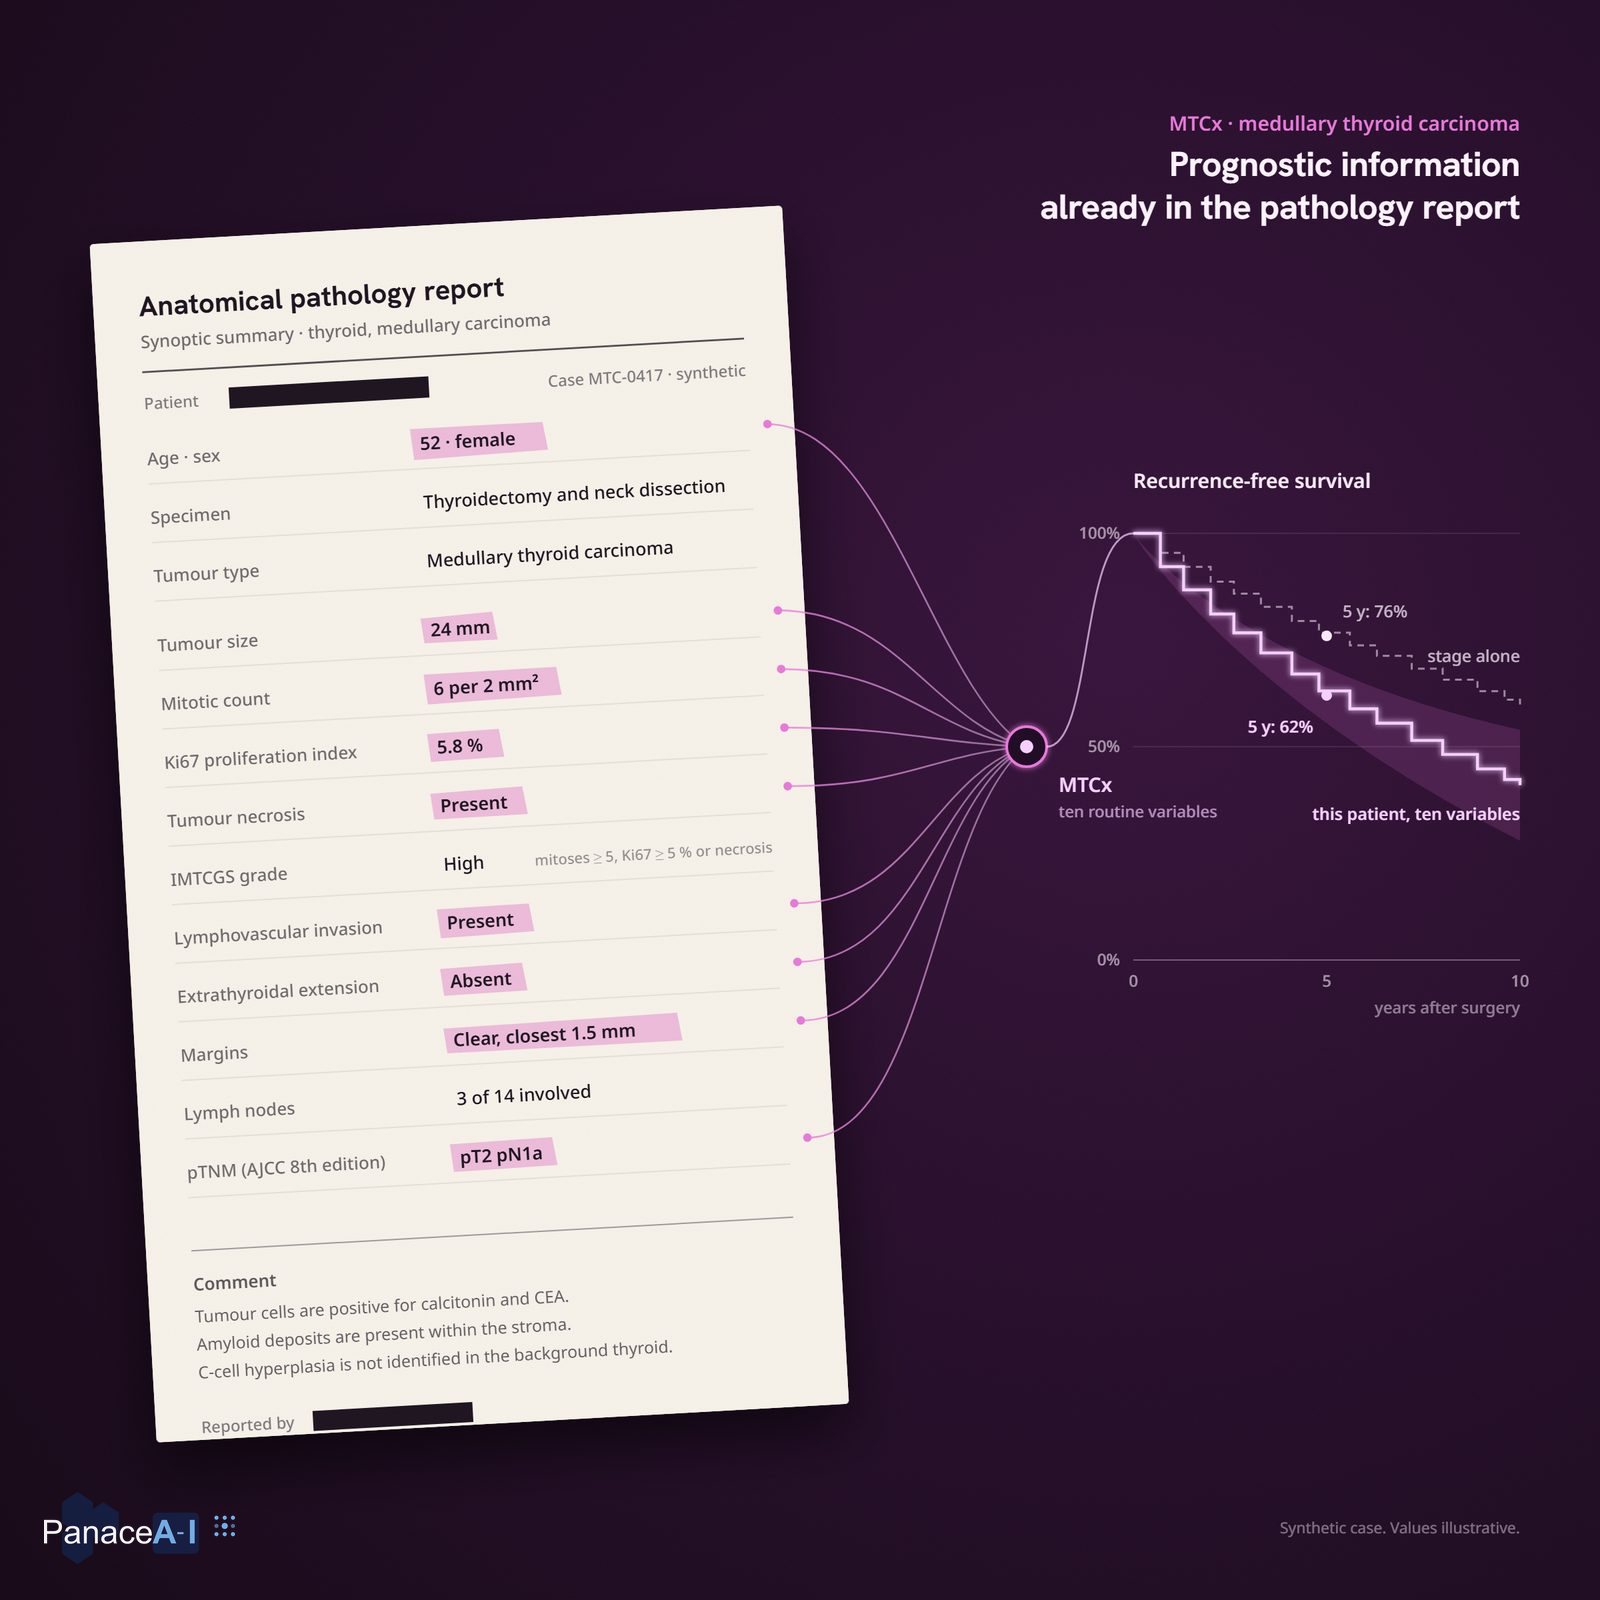
Ten highlighted variables in a pathology report run into one point and open into one patient's recurrence-free survival curve.
A beam of marks, one for each clinical trial, narrowing through a cyan section to a gold point: one mark, one trial.
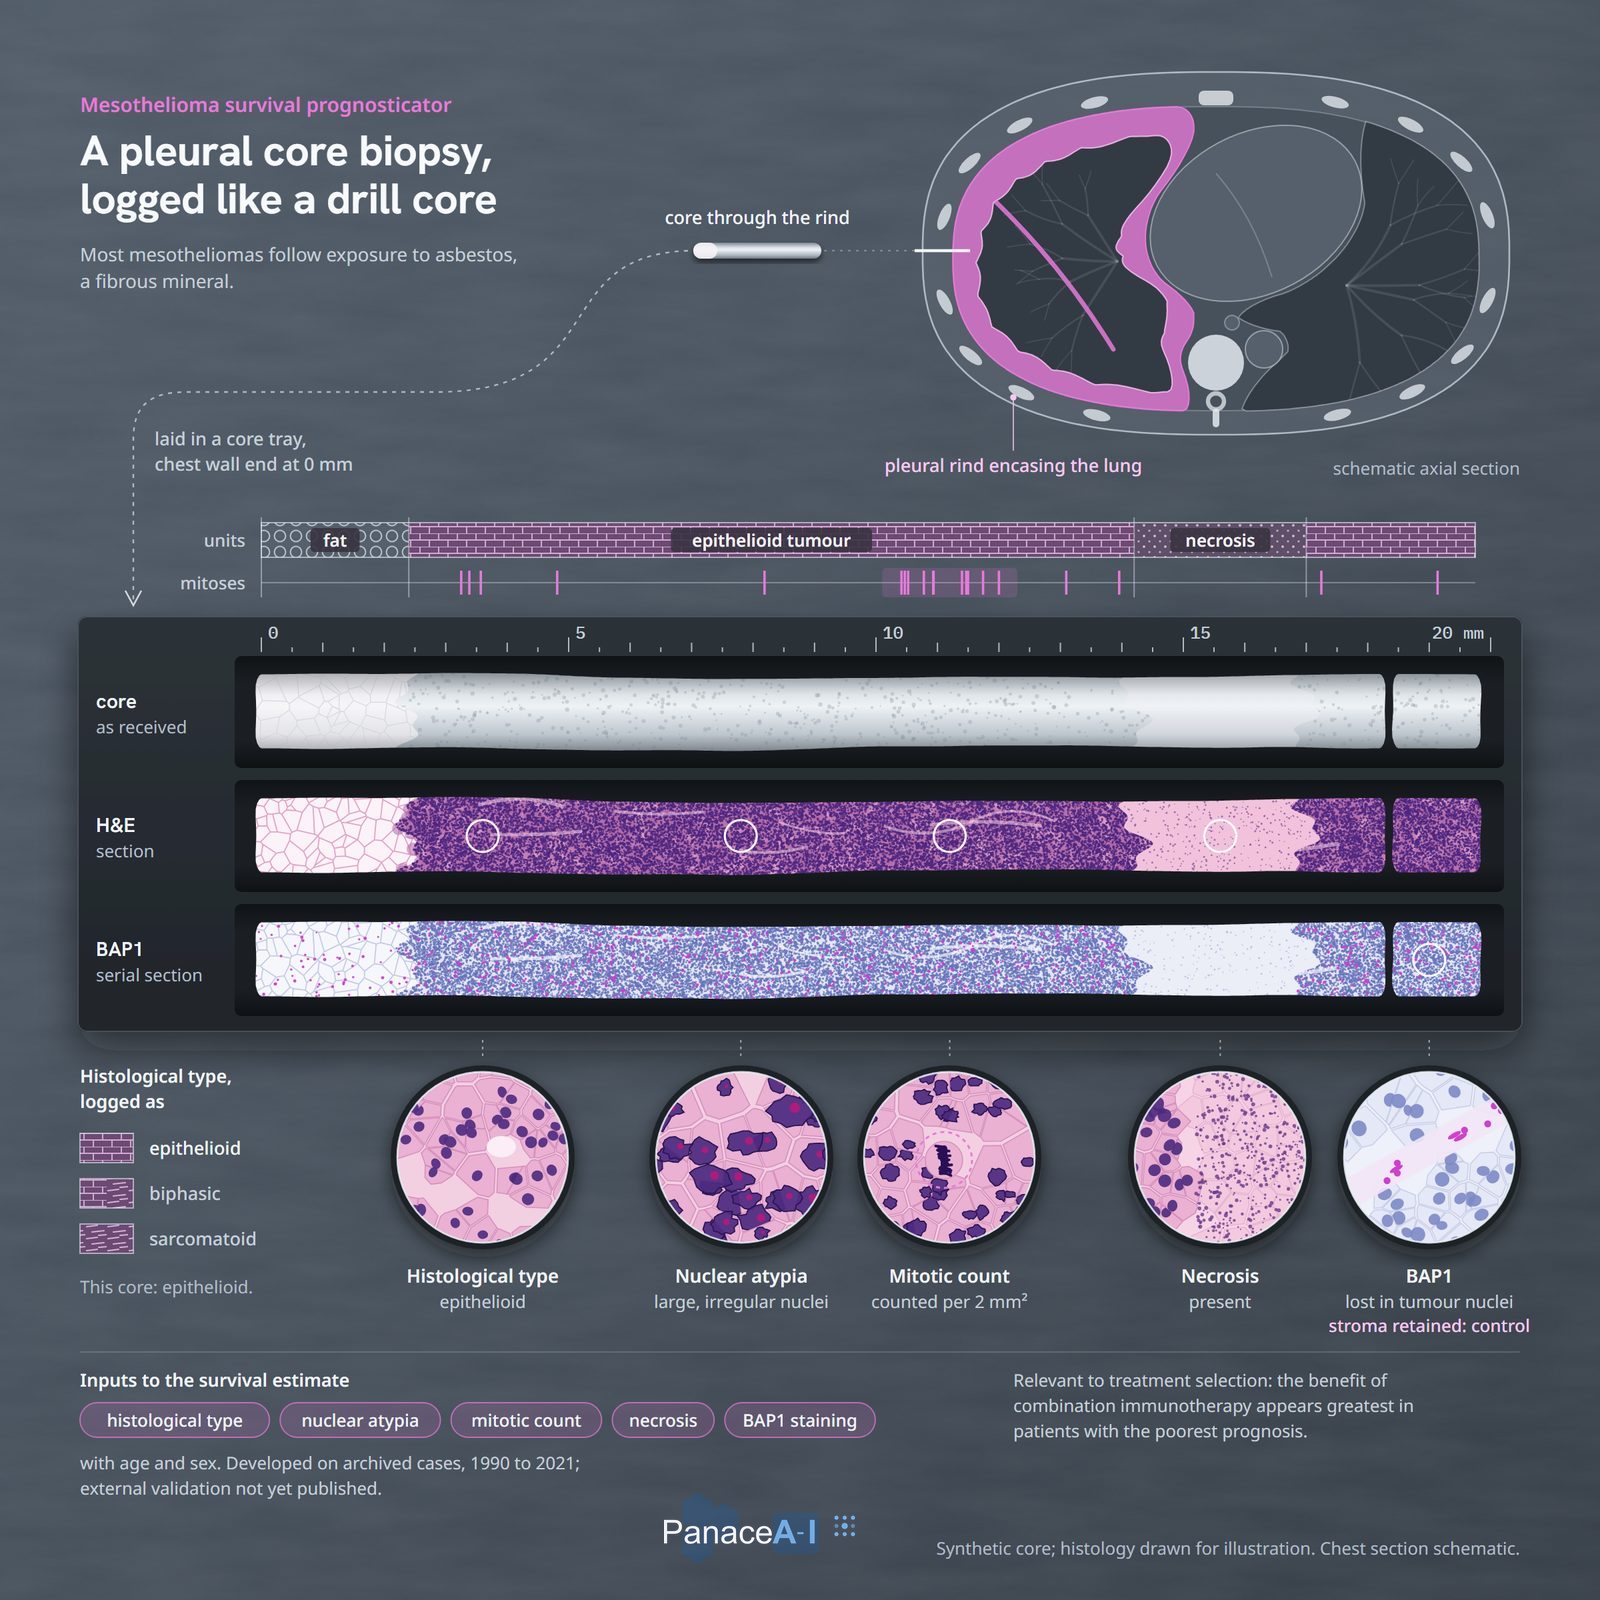
A pleural core biopsy in a core tray: as received, stained with haematoxylin and eosin, and stained for BAP1, above five round close-ups of the tissue.
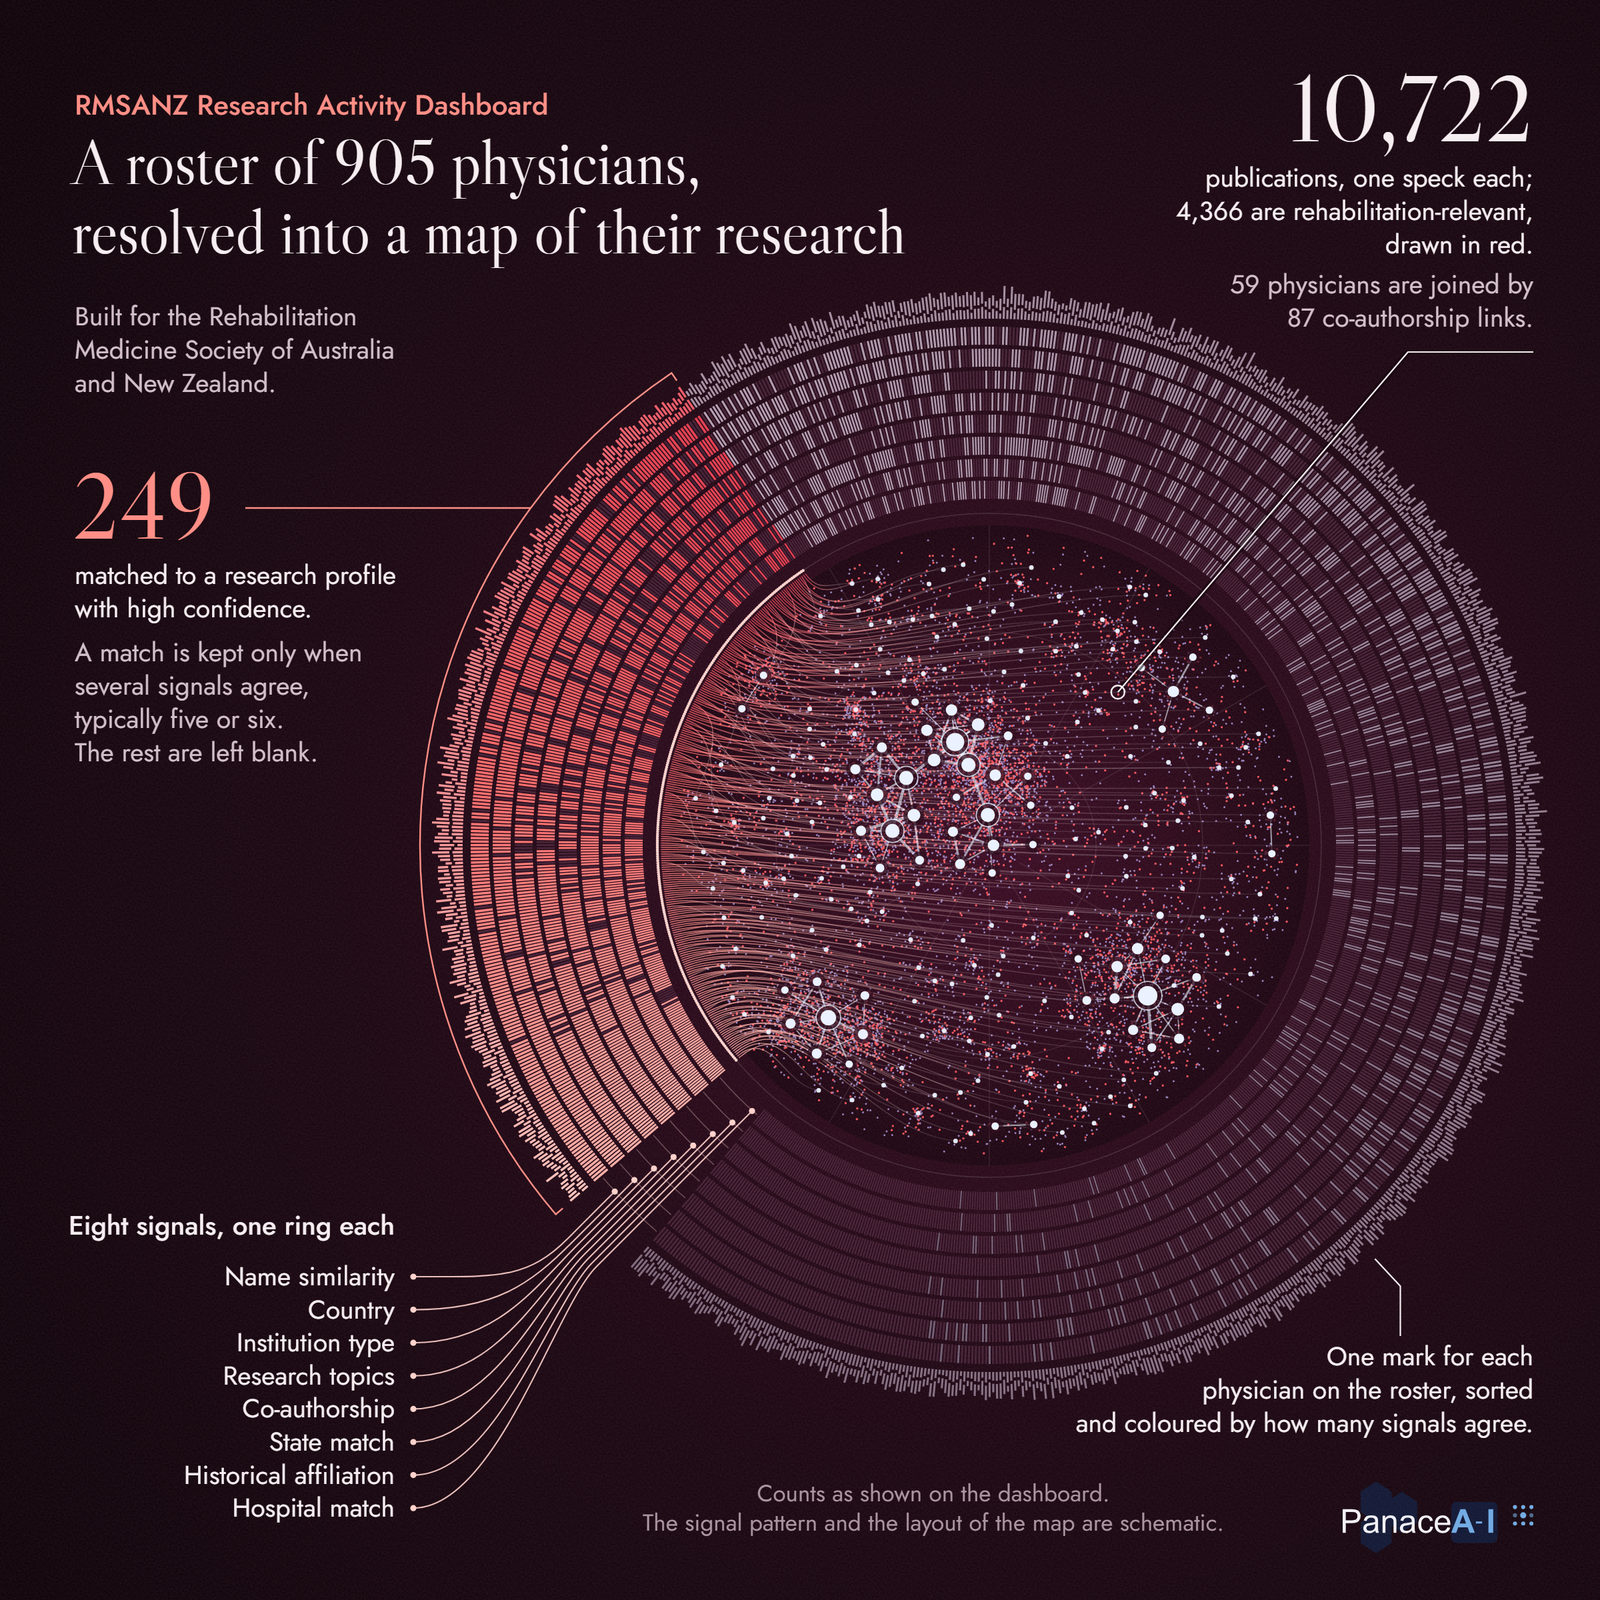
A dial of roster marks and rings of signal cells, with a coral arc for the 249 matched physicians and their publications drawn as a map in the centre.
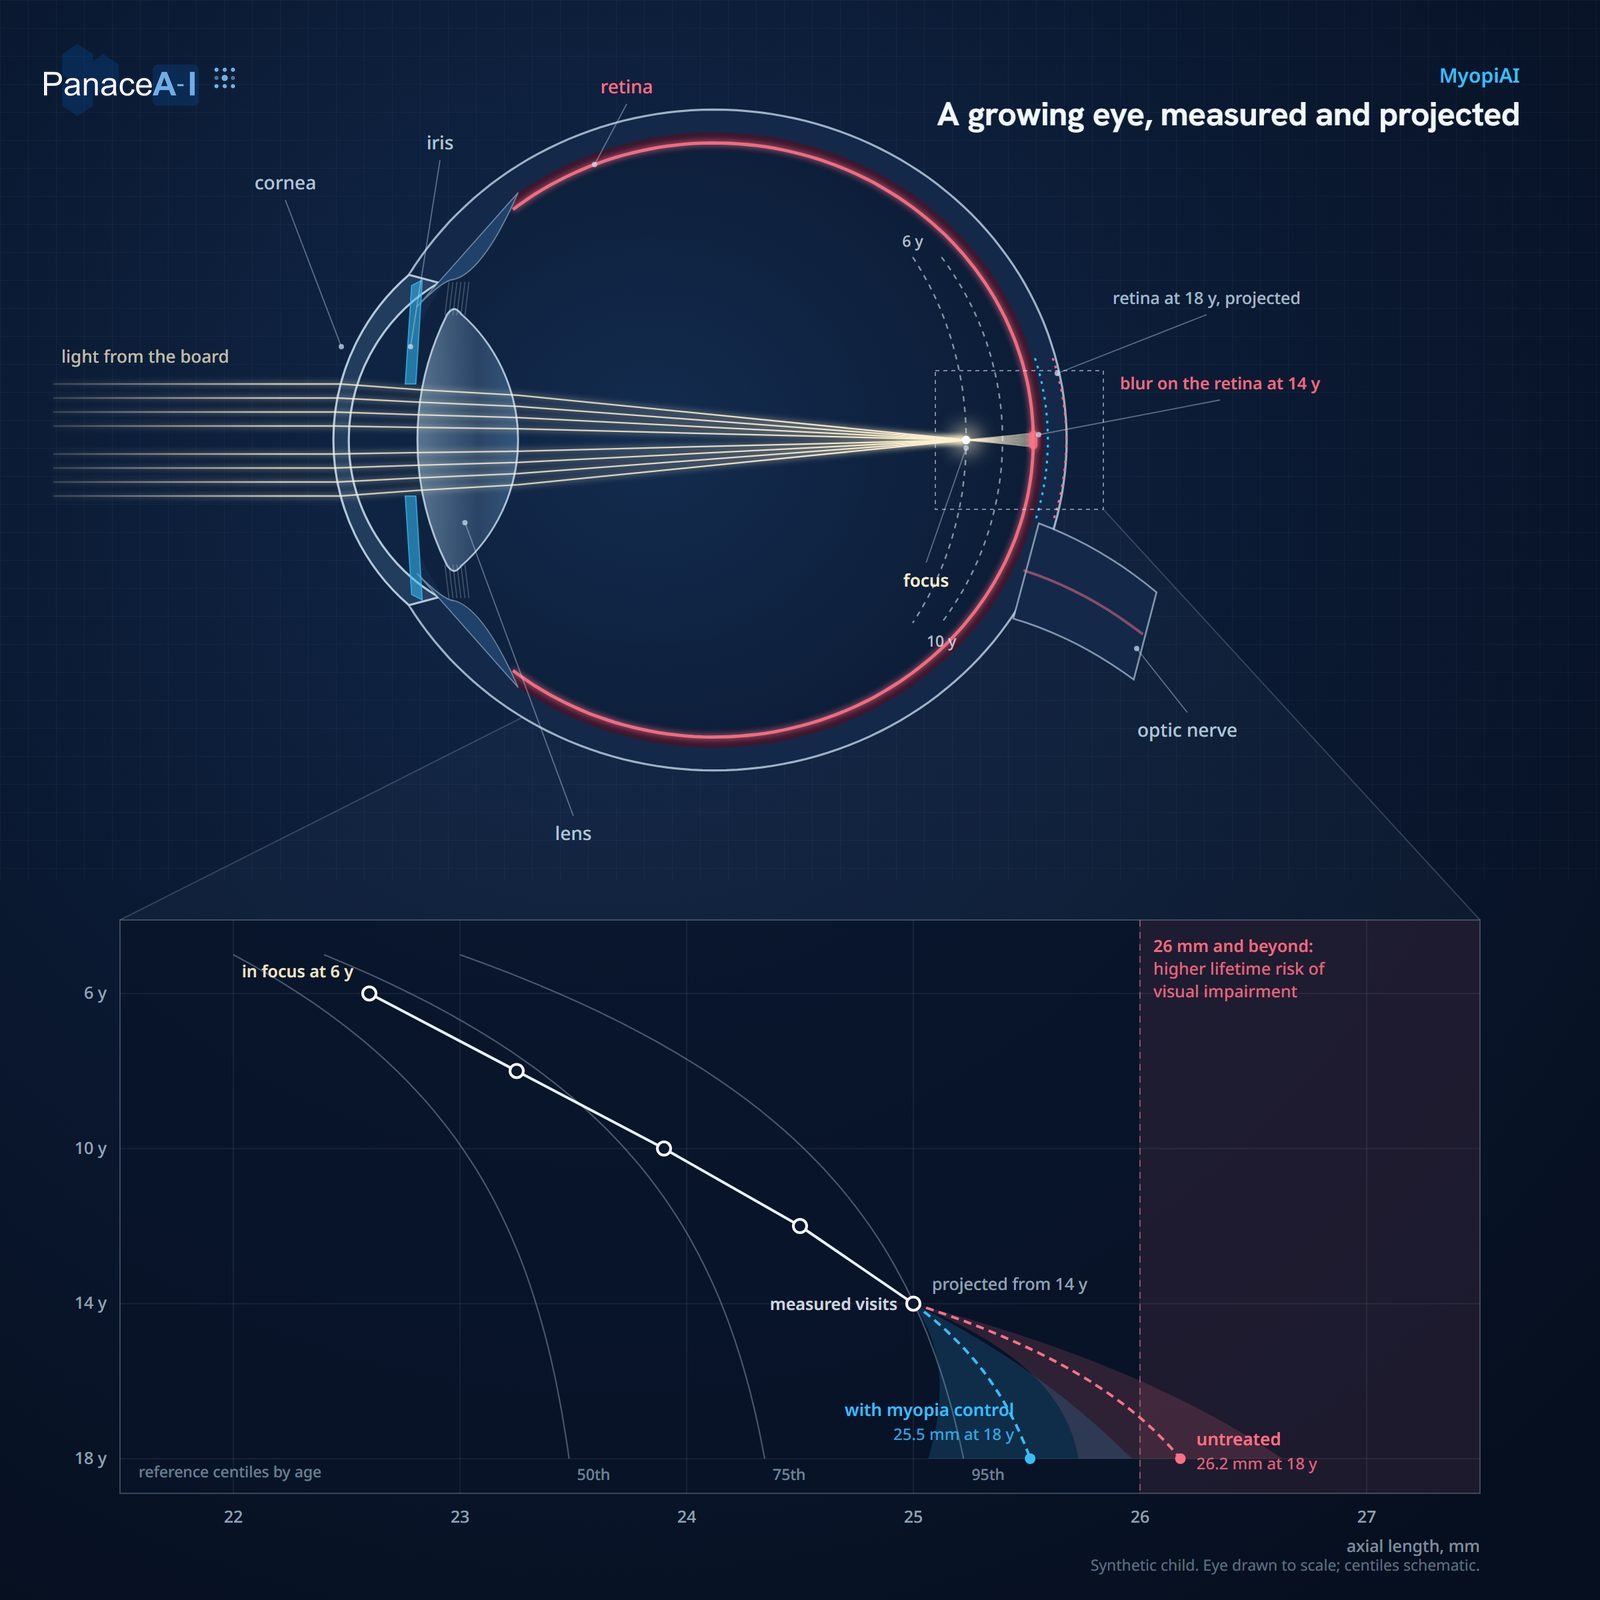
A section through a growing eye, with rays of light meeting just in front of a rose retina.

Health research intelligence and clinical AI, taken the whole way.

1 / 6Research intelligence

RAMS+

Ten years of research across the NSW Health and Innovation Precincts, in one place. Designed and built for NSW Health.

PanaceAI builds research intelligence platforms that show a health system who is doing what research, and clinical AI tools that are tested, published and open for clinicians to use. We also advise on how AI in health is evaluated and governed, answer health research questions with data science, and build custom apps with AI and data features.

About twenty tools and platforms built and deployed, with platforms designed and built for NSW Health and for the Rehabilitation Medicine Society of Australia and New Zealand, and clinical tools built on peer-reviewed models published in Histopathology, Pathology and ANZ Journal of Surgery.

Organisations in the work on this page

  • NSW Health
  • RMSANZ
  • Royal North Shore Hospital
  • Memorial Sloan Kettering
  • Brigham and Women's
  • Gustave Roussy
  • University of Bologna
  • Emory University
  • The Daffodil Centre
  • The Centenary Institute
  • Acuity Intelligence
  • Australia's Economic Accelerator

Each in the part it played

Part one: Health research intelligence

AI-powered health research intelligence: platforms that show who is doing what research across institutions. The AI does the linking: it resolves people, hospitals and trials to single records and classifies what each publication is about. Every match can be traced, and a wrong one reported and corrected.

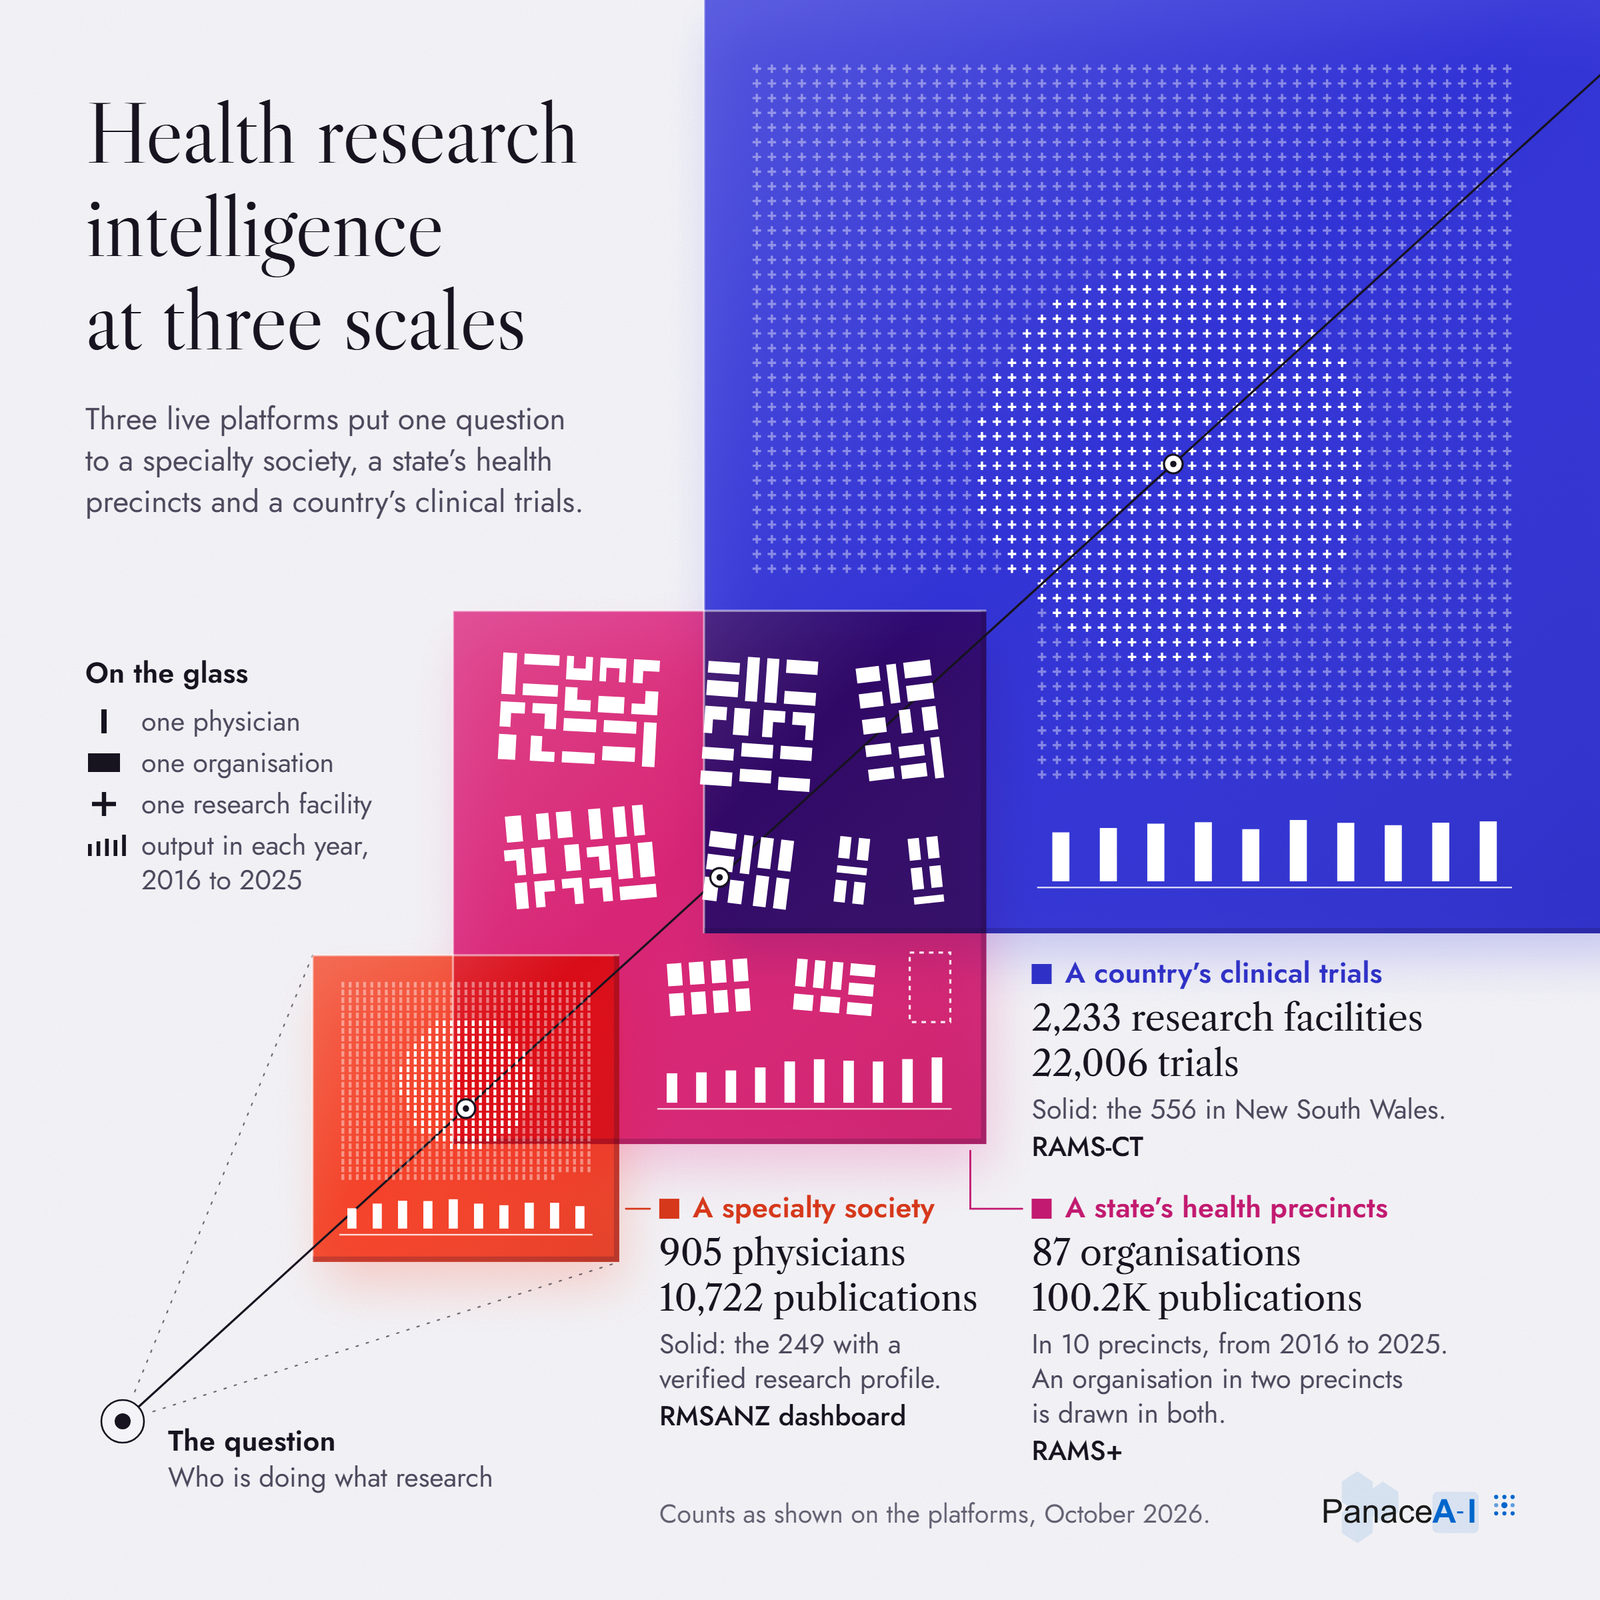
A poster on a pale ground: one line of sight runs up through three overlapping panes of coloured glass, a small vermilion pane with 905 strokes for physicians, a magenta pane with a plan of organisations in ten precincts, and a large ultramarine pane with 2,233 crosses for research facilities.
One question at three scales: a specialty society, a state's health precincts, a country's clinical trials.

One question, asked at three scales

Who is doing what research.

We have built the answer for a specialty society and its roster of 905 physicians, for a state's ten health precincts and their 87 organisations, and for a country's 2,233 research facilities and 22,006 clinical trials.

The hard part is the linking: a person to their papers, a paper to the hospital where the work was done, a trial to the same trial in another registry. Each platform shows how its matches were made.

The same approach can be built for a single hospital, a local health district, a university faculty or a funder's portfolio.

RAMS+, a state's health precincts RAMS-CT, a country's clinical trials RMSANZ, a specialty society

Ten glowing discs of small dots on a deep violet ground, one for each NSW health and innovation precinct, sized by publications from Randwick to Murrumbidgee, each running from blue at its centre to gold at its rim, with fine ticks, beads and pale threads around and between the discs.
Each dot is ten publications, ringed by year from 2016 at the core to 2025 at the rim.

RAMS+

Research activity across the NSW Health and Innovation Precincts.

Designed and built for NSW Health, 2025 to 2026.

RAMS+ brings together about 100,000 publications from 2016 to 2025, about 11,300 NSW clinical trials that started from 2011 to 2026 and about 7,800 precinct-mapped grants, and links them to 87 organisations in ten precincts, so that a health system can see the research it produces and supports.

Hospital research is undercounted when authors name only their university. RAMS+ recovers the hospital where the work was done, and shows how sure each match is.

Ten years of a state's research, one year at a time

Drag the year across the precincts, or use the slider.

In 2025, 11,815 publications were linked to the precincts, 54% more than in 2016. Ten-year total: 100,209.

Publications by precinct and year, as shown on the platform on 12 October 2026. A paper shared by two precincts is drawn in both rows; the yearly total counts each paper once. The tenth precinct, Macquarie Park, appears on the platform through its clinical trials.

RAMS+ itself

Thirteen views sit behind the precinct cards, from grants and trials to collaboration networks and the linkage method. Four of them, redrawn.

The precincts view of RAMS+, redrawn: a dark dashboard titled NSW Health and Innovation Precincts with a strip of four counts and six precinct cards led by Randwick with 31.3K publications, each with a ten-year line. The compare view of RAMS+, redrawn: four precincts chosen, a four-axis profile, grouped bars of publications by year from 2016 to 2025, and a table of key figures. The organisations view of RAMS+, redrawn: a table of ten precincts by six kinds of organisation, a dot for each organisation and a total for each precinct. The network view of RAMS+, redrawn: nine precincts on a ring joined by coloured bands of different widths, beside a list of the strongest pairs and of the precincts by output.

Precincts: counts for the whole system, then each precinct ranked by publications, with ten years of output as a line.

Open RAMS+ (opens in a new tab)
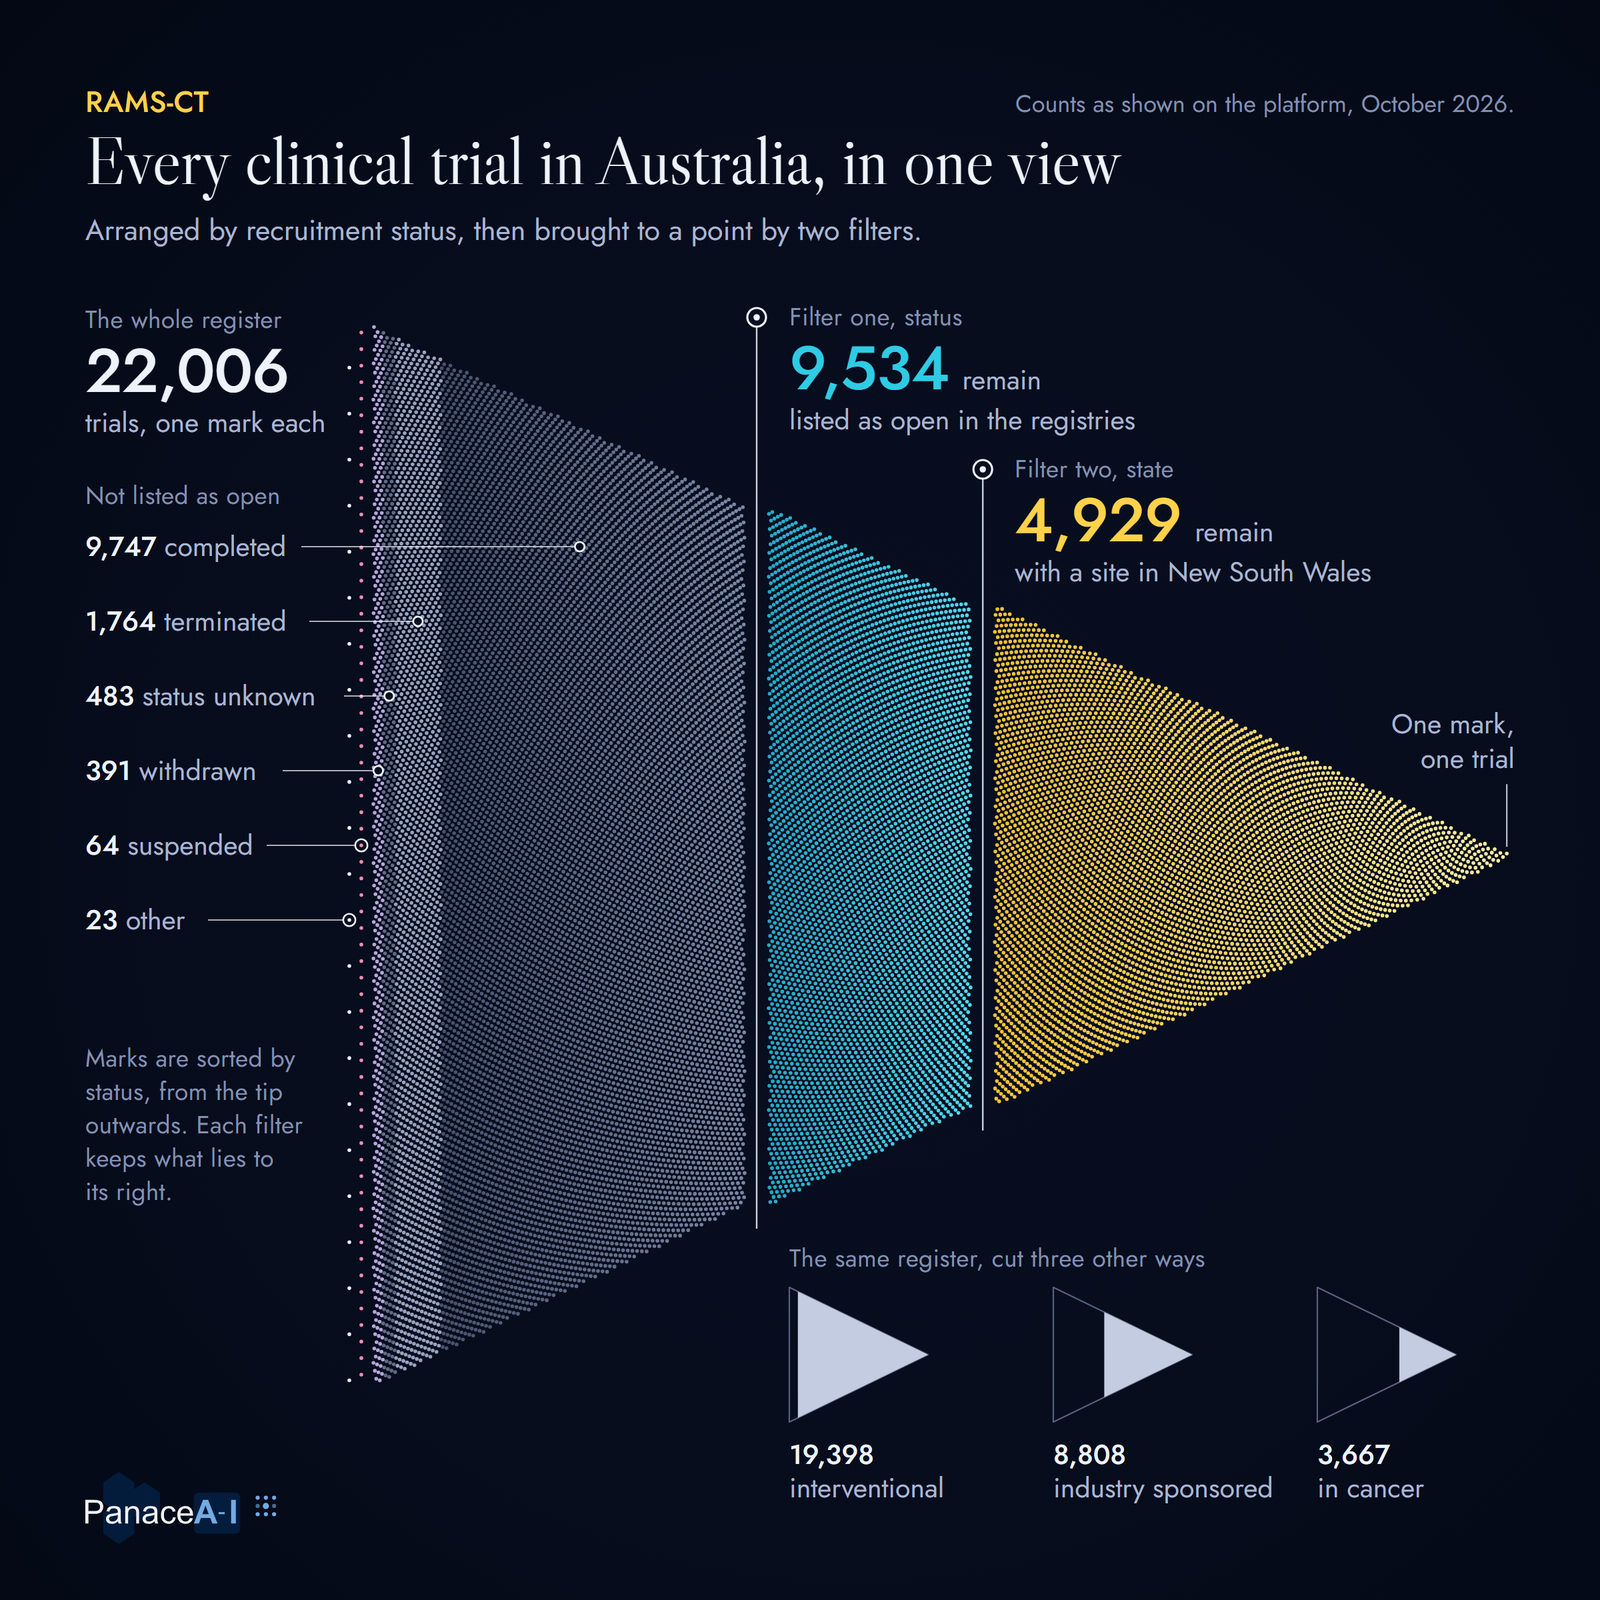
A beam of 22,006 small marks narrowing from left to right to a single mark: a wide grey section for trials not listed as open, a cyan section for the 9,534 listed as open, and a gold section for the 4,929 with a site in New South Wales.
All 22,006 trials in the register, one mark each, brought to a point by two filters.

RAMS-CT

Every clinical trial with an Australian site in one view, with a NSW governance lens.

Designed and built for NSW Health, 2025 to 2026.

RAMS-CT gathers the trial registries into one de-duplicated register of 22,006 trials with at least one Australian site: 19,398 interventional, 9,534 listed as open in the registries, running across 2,233 research facilities and 28 therapeutic areas.

Every site name is resolved to a single facility. More than a hundred spellings of one Sydney hospital collapse into one.

The whole register, cut five ways

Each mark is twenty trials. Choose a cut and the 22,006 regroup.

The register of 22,006 trials drawn as 1,100 marks and grouped by the chosen cut. The counts are listed beside it.

Point atTap a block of marks to read it.

Of the 22,006 trials, 9,534 are listed as open in the registries and 9,747 are completed.

  • Recruiting4,653
  • Not yet recruiting3,236
  • Active, not recruiting1,585
  • Enrolling by invitation60
  • Completed9,747
  • Terminated1,764
  • Status unknown483
  • Withdrawn391
  • Suspended64
  • Other23
Where the trials run

Counting every trial ever registered, Victoria leads New South Wales by 211.

A trial is counted in every state it runs in, so the bars overlap. Counts as shown on the platform on 12 October 2026.

  1. VictoriaVIC11,426
  2. New South WalesNSW11,215
  3. QueenslandQLD7,420
  4. South AustraliaSA5,720
  5. Western AustraliaWA5,499
  6. TasmaniaTAS1,866
  7. Australian Capital TerritoryACT1,860
  8. Northern TerritoryNT1,287

RAMS-CT itself

Ten views, from a facility map to the networks of institutions that run trials together. Four of them, redrawn.

The Explore view of RAMS-CT, redrawn: a filter panel over 22,006 trials with a chip for each state, a bar for each state led by Victoria and New South Wales, and an area chart of registrations by year from 2016 to 2025. The map view of RAMS-CT, redrawn: an outline of New South Wales with marks for research facilities gathered on Sydney and the coast, beside counts by sector: 199 public, 108 private or commercial, 50 academic or independent. The trends view of RAMS-CT, redrawn: a bar for each therapeutic area, leaving a centre line to the right where registrations rose and to the left where they fell. The chart studio of RAMS-CT, redrawn: six dropdowns above a stacked area chart of trial registrations by year from 2016 to 2025, in eight bands for the types of sponsor.

Explore: one shared filter over all 22,006 trials, with every chart recomposing as it changes.

Open RAMS-CT (opens in a new tab)
A large dial on a dark garnet ground: 905 small marks around its rim, eight concentric rings of cells inside them, and about a quarter of the dial glowing coral where enough signals agree; fine threads run from that arc into the centre, where 249 points, 59 of them joined by lines, sit in a cloud of 10,722 specks.
905 physicians on the rim, eight rings of signals, and the 249 kept matches drawn as a map.

RMSANZ Research Activity Dashboard

What the members of a specialty society publish, with whom, and where.

Built for the Rehabilitation Medicine Society of Australia and New Zealand.

A roster of 905 physicians is checked against eight signals. The 249 matched with high confidence are kept, with their 10,722 publications, 4,366 of them rehabilitation-relevant. The rest are left blank and never guessed.

Every match between a physician and a research profile carries a confidence grade, and members can report a wrong match from their own profile.

A roster, resolved into a research map

Drag from the roster to the map.

The 249 and their 10,722 publications, drawn as a map: 4,366 are rehabilitation-relevant, and 59 physicians are joined by 87 co-authorship links.

  1. Name similarity
  2. Country
  3. Institution type
  4. Research topics
  5. Co-authorship
  6. State match
  7. Historical affiliation
  8. Hospital match

The counts are the dashboard's own, as at May 2026. Which marks agree on which signals, and where each physician sits on the map, are drawn for this page.

A roster of 905 marks, of which 249 leave the roster and form a map of their publications.

The dashboard itself

Twelve views for the society's office, its research leads and its members, with search, expert finding and the method published beside them. Four of them, redrawn.

The overview of the RMSANZ Research Activity Dashboard, redrawn: a deep red sidebar listing twelve views and a pale page of cards with seven figures, a stacked bar chart of publications by year and a bar chart of members by state. The research heatmap of the RMSANZ dashboard, redrawn: a grid of fifteen subjects by sixteen years shaded from white to deep red. The collaboration view of the RMSANZ dashboard, redrawn: four figures above a network of 59 unnamed points in four groups, joined by 87 fine lines. The benchmarking view of the RMSANZ dashboard, redrawn: six soft ridges of percentile ranks, and six bands from the 25th to the 95th percentile with the median marked.

Overview: 249 of 905 physicians resolved, 10,722 publications, and output by year from 2005 to 2025.

Open the dashboard (opens in a new tab)
Part two: Clinical AI

Prognostic and decision-support tools, most of them taken the whole way: from a clinician's dataset to a tested, published tool that clinicians can open. The published models come from research at the Kolling Institute, Royal North Shore Hospital and the University of Sydney, with the other centres named in each study.

A tilted cream pathology report on a dark aubergine ground, with ten of its entries highlighted in pink and joined by fine lines to a single point, which opens into a stepped survival curve at the right.
MTCx reads ten variables already in a pathology report and returns one patient's recurrence-free survival curve. The case is synthetic.

MTCx recurrence prognosticator

Predicts recurrence-free survival in medullary thyroid carcinoma, a rare thyroid cancer.

Developed on
300 patients from five centres in four countries
Tested on
87 patients at Emory University
Published in
Histopathology, 2024

The model is one step of seven

Most people picture only the fourth. Drag through the seven, or use the arrow keys.

  1. The question
  2. The patients
  3. The method
  4. The model
  5. The independent test
  6. Peer review
  7. Release

Release. A working calculator that any clinician can open, with the question, the patients, the method, the test and the paper behind it.

The model: ten variables already in the pathology report go in, and one patient's recurrence-free survival curve comes out.

0.90AUC in the independent test,
against 0.94 in development
(1.0 would separate every patient correctly)

Histopathology, 2024

Novel prognostic nomogram for predicting recurrence-free survival in medullary thyroid carcinoma

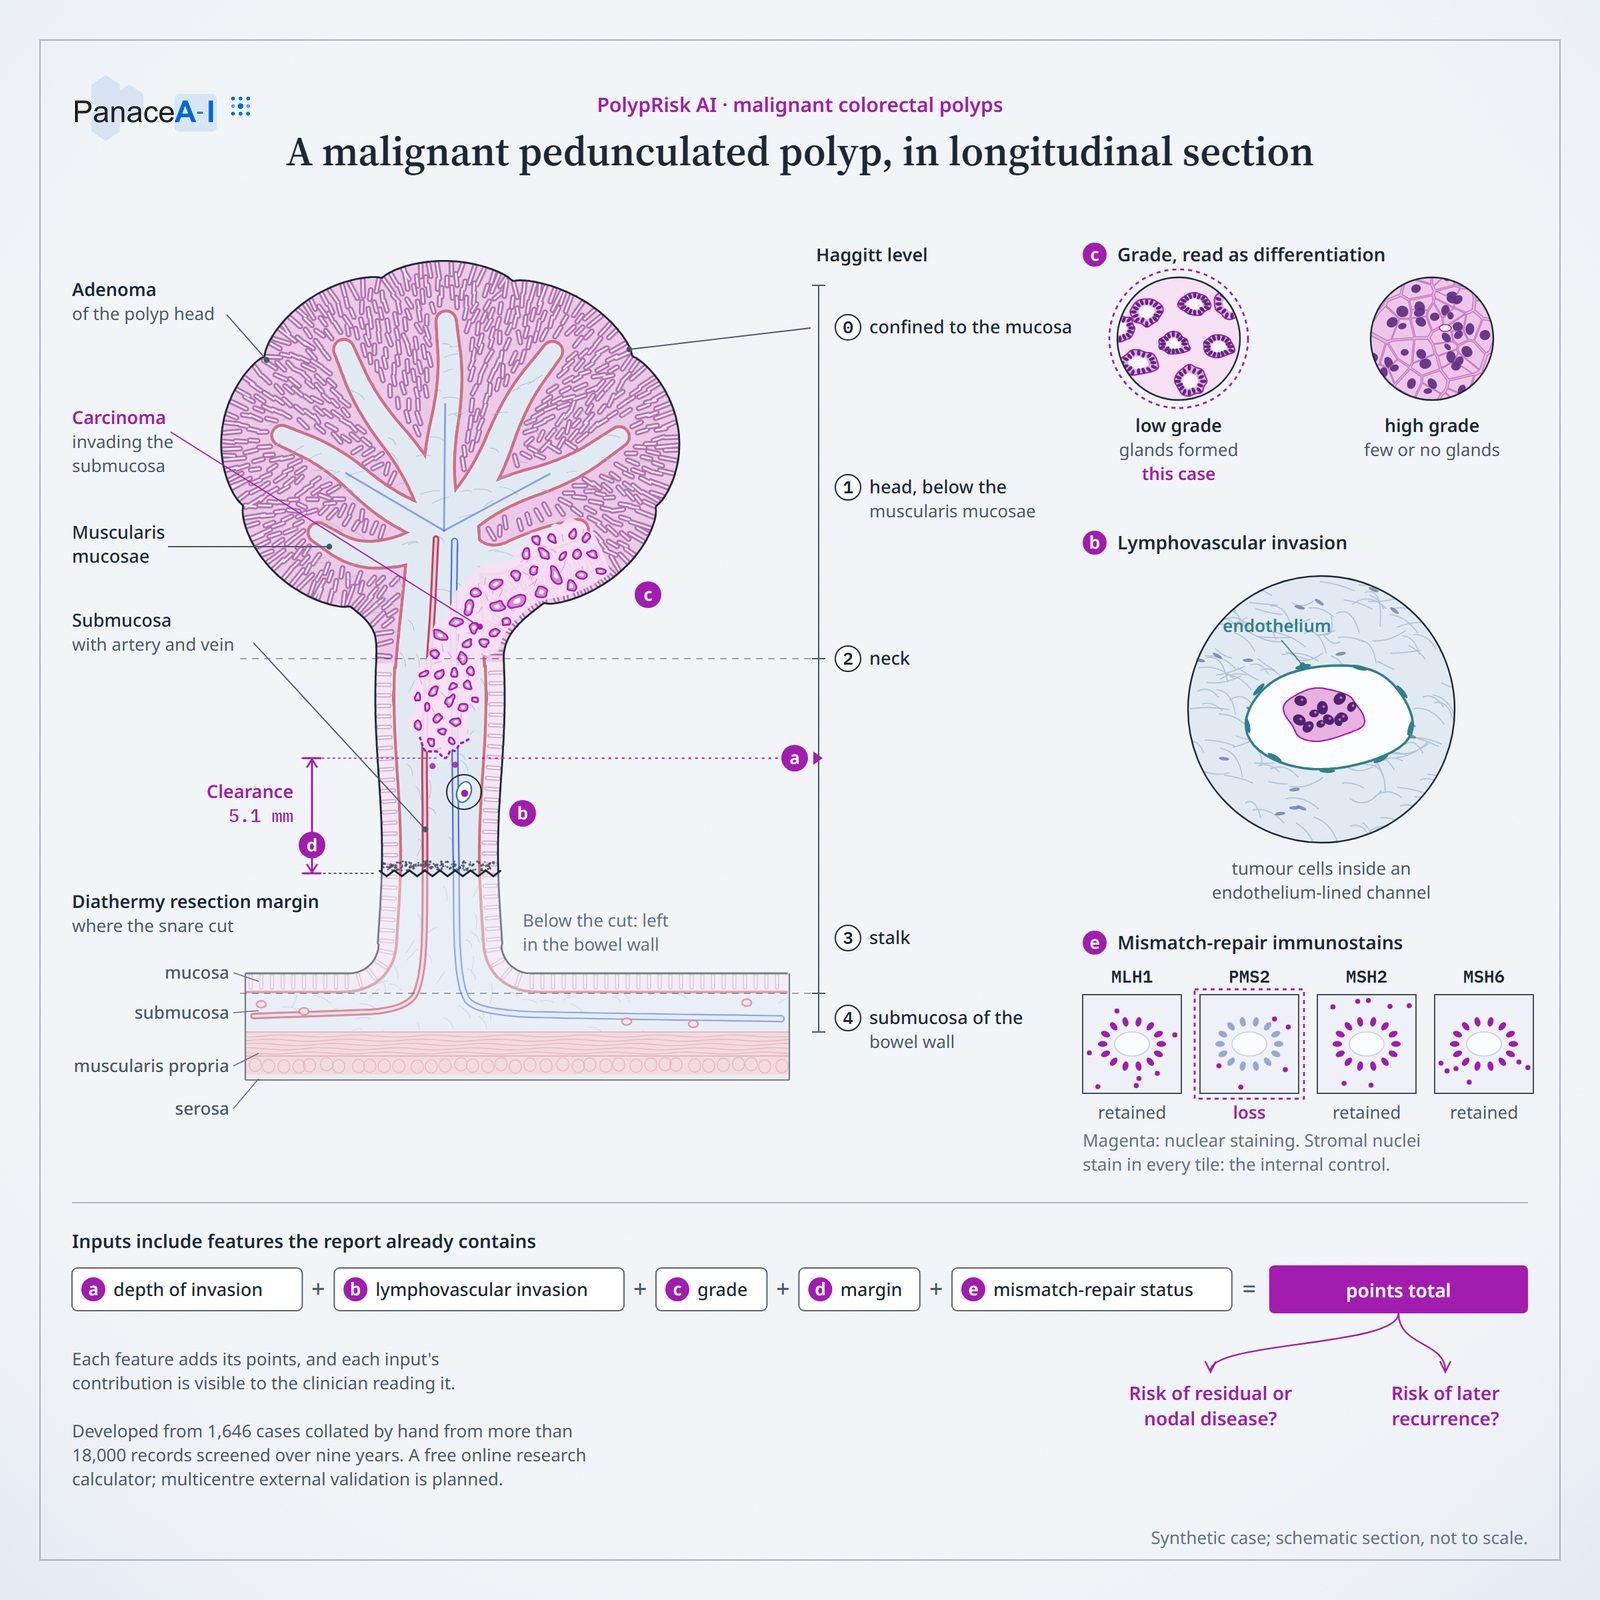
An anatomical drawing on a pale ground of a mushroom-shaped polyp cut lengthwise on its stalk, in pink and violet, with labels for its layers and levels, small panels for grade, vessel invasion and immunostains, and a row of five inputs adding into a points total.
A malignant stalked polyp in longitudinal section, with the features that add into the points total.

PolypRisk AI

For patients whose removed colorectal polyp turns out to be malignant: the risk of residual disease and of recurrence.

Developed on
1,646 malignant polyps, drawn from 18,303 Queensland Cancer Registry records. One dot, one polyp.
With
the University of Queensland and Royal Brisbane and Women's Hospital
Published in
ANZ Journal of Surgery, 2025
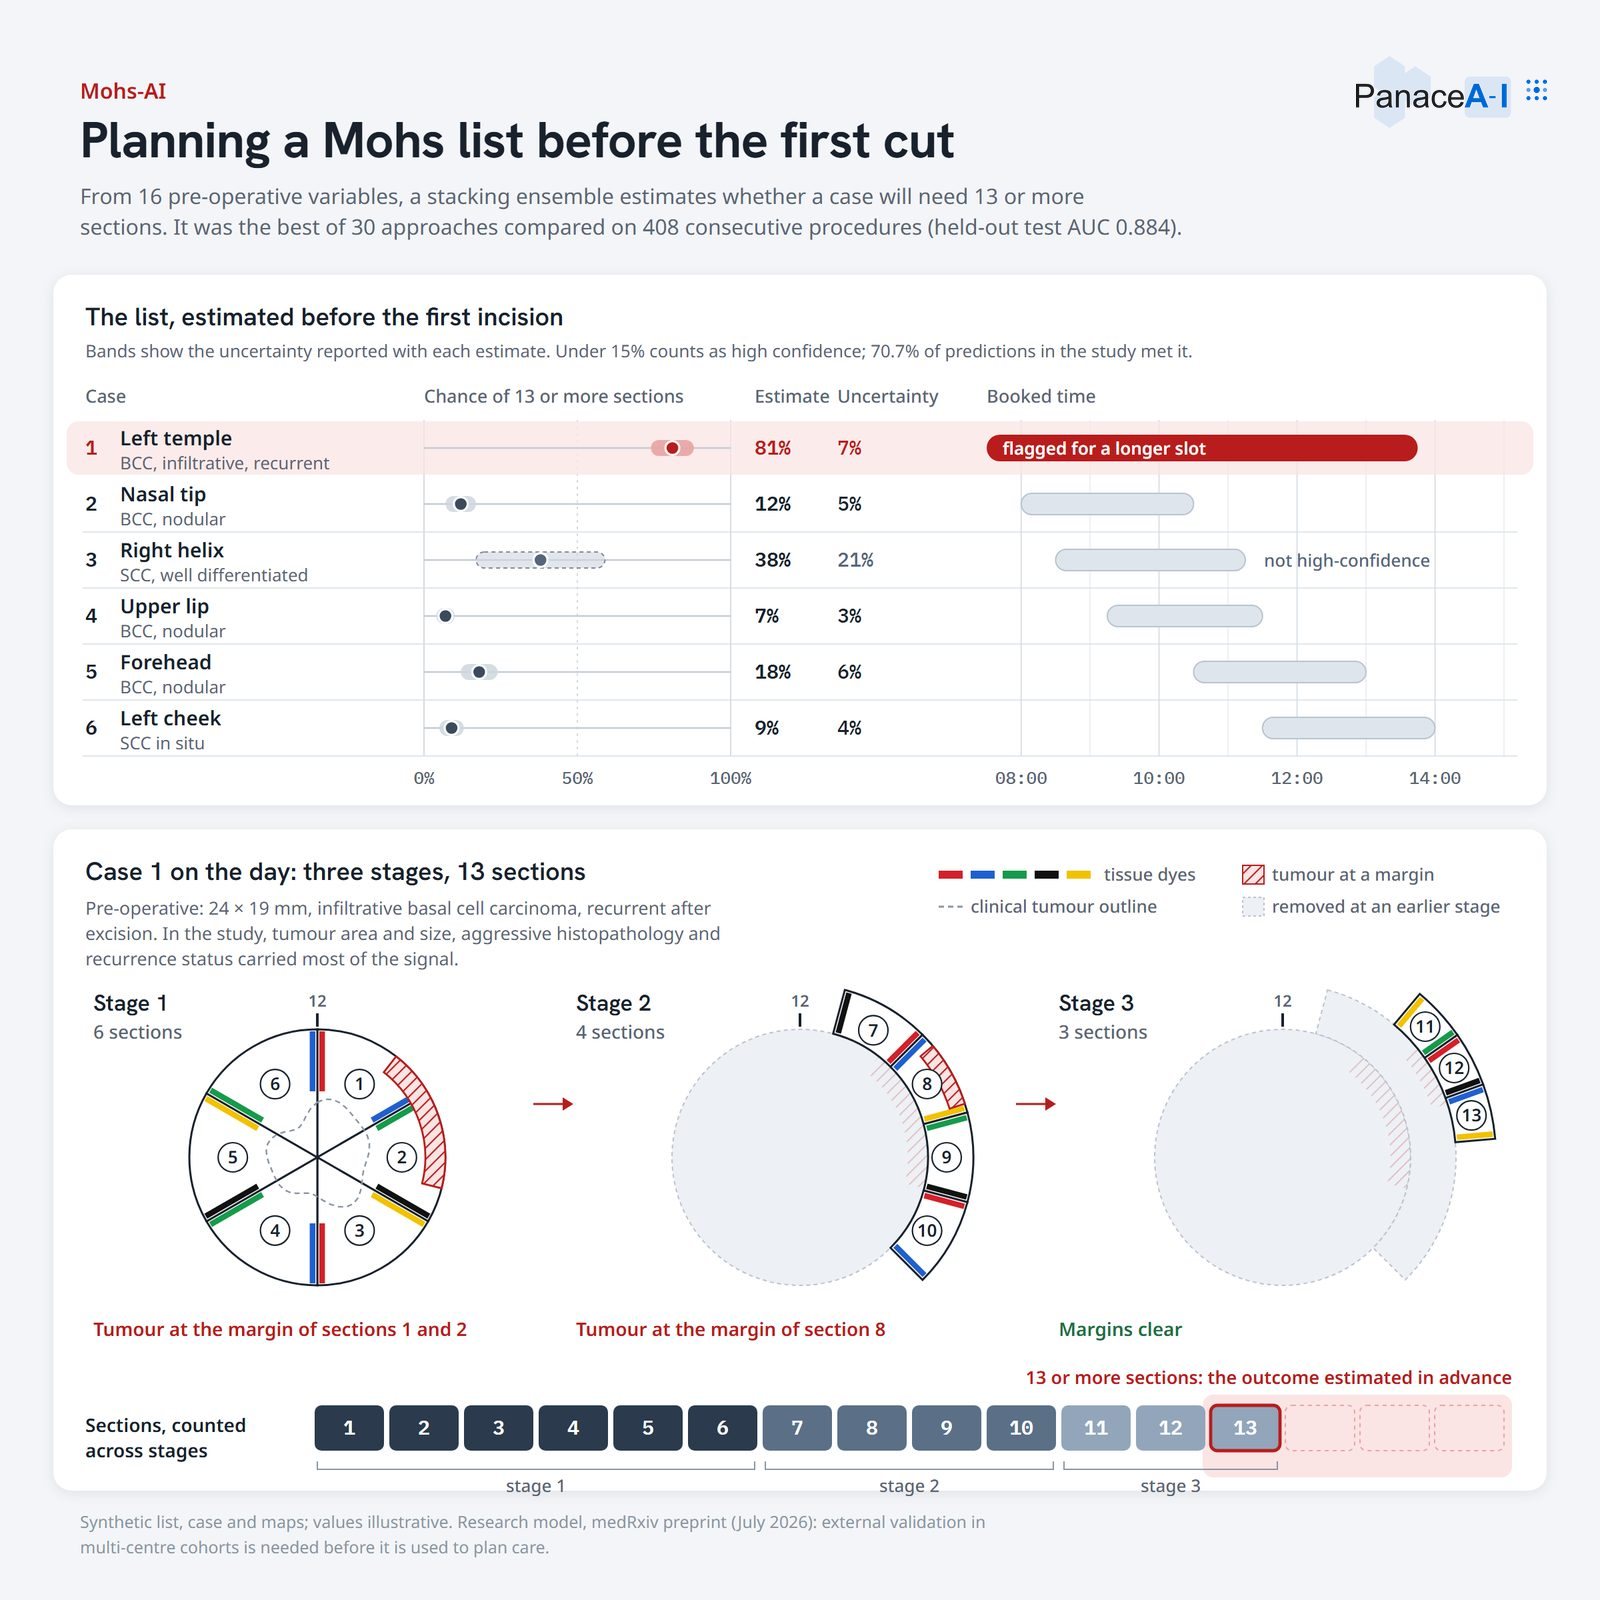
A light plate in two cards: above, a list of six cases with a dot and band for each estimate and a booked time bar, the first flagged in red; below, three circular tissue maps for the stages of one operation and a row of thirteen numbered sections.
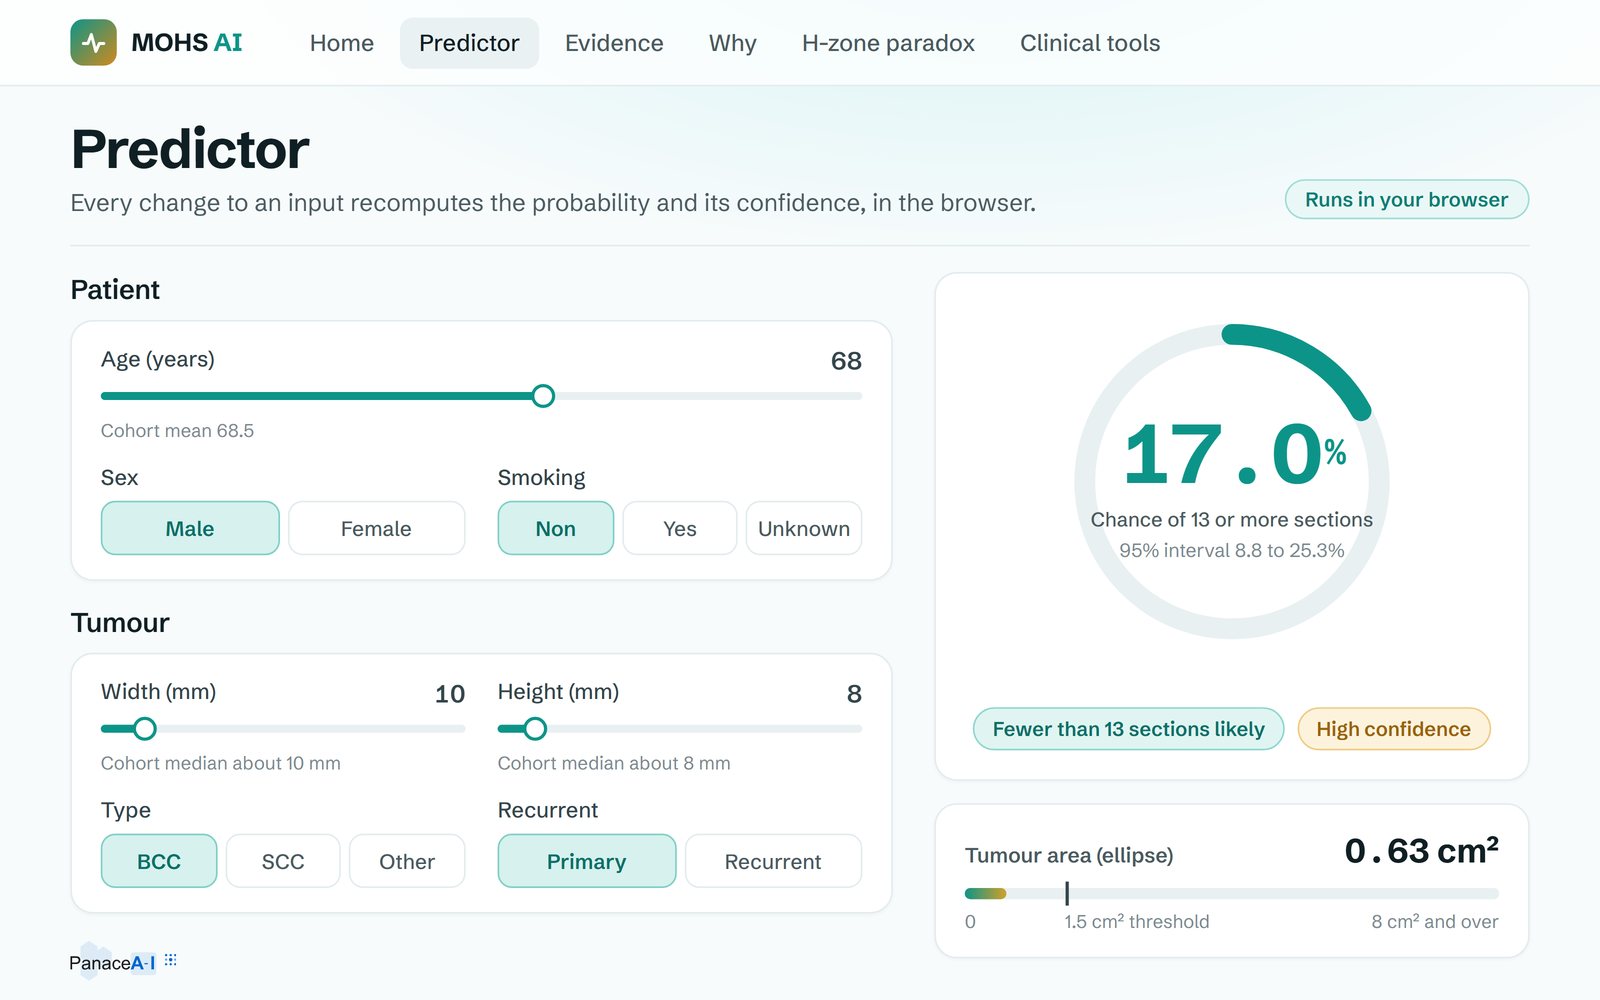
An operating list estimated before the first cut, and one flagged case followed through three stages of Mohs mapping. The list and the case are synthetic.

Mohs-AI

Flags, before surgery, which Mohs skin cancer operations are likely to need 13 or more sections, so that an operating list can be planned.

Developed on
408 procedures at The Skin Hospital. One dot, one procedure.
Preprint
medRxiv, 2026
The predictor of the Mohs-AI tool, redrawn: sliders for age and for the width and height of the tumour, choices for type and recurrence, and a dial reading a 17.0% chance of 13 or more sections.
The predictor of Mohs-AI, redrawn: move an input and the estimate follows.
A section through an eye on a navy ground, with rays of light meeting just in front of a rose retina; below it a chart of eye length against age in which a measured white line splits at fourteen years into a blue projection and a rose one.
A growing eye drawn to scale, opening into a chart of axial length against age with two projected futures. The child is synthetic.

MyopiAI

Decision support for childhood myopia: predicted eye growth, treatment scenarios and uncertainty.

Its estimates come from published cohorts and a modelled population, and it has not yet been tested in clinics.

Built by
Acuity Intelligence, a company co-founded by PanaceAI's founder
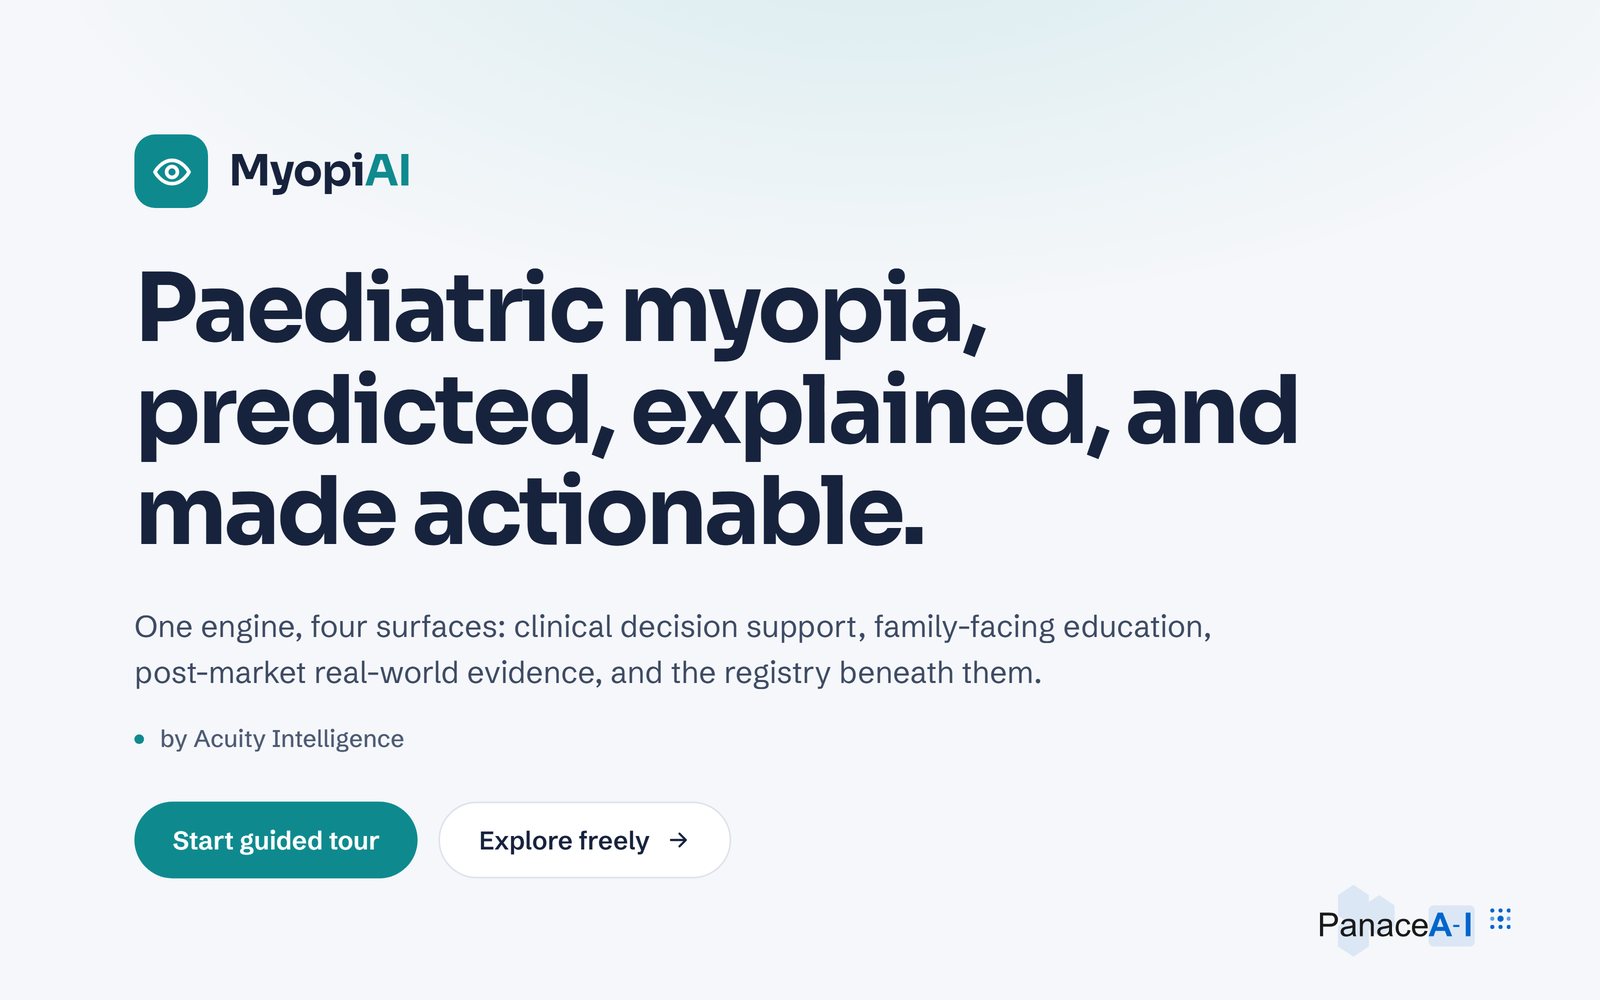
The opening screen of the MyopiAI platform, redrawn: the name, the line Paediatric myopia, predicted, explained, and made actionable, a credit to Acuity Intelligence and two buttons.
The opening screen of the platform, redrawn.

Part three: Evaluation and governance of AI

Independent evaluation of AI tools before they are adopted, and the policies, registers and review processes an organisation needs to use AI responsibly.

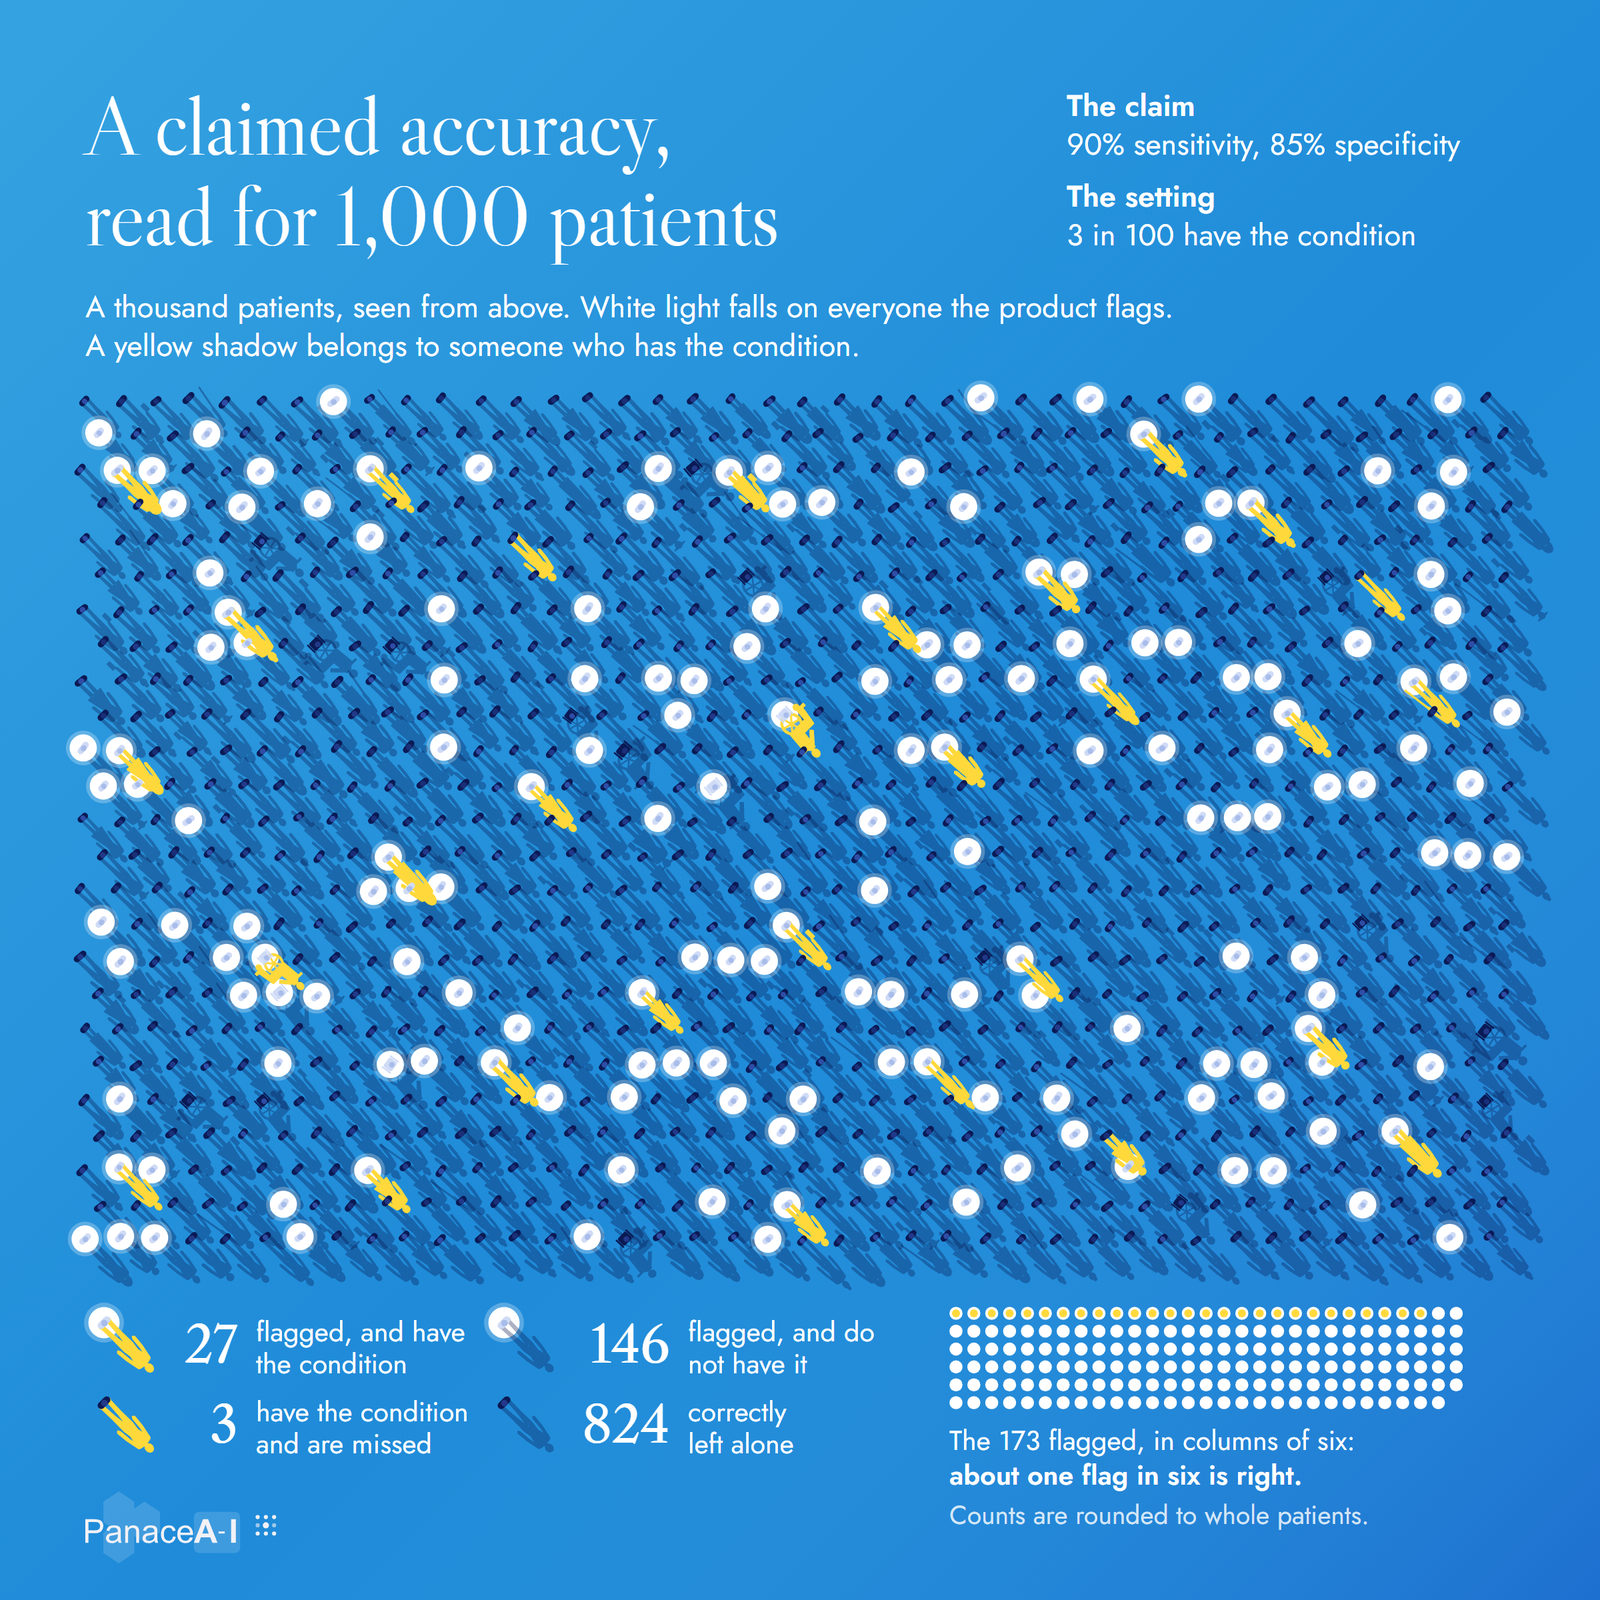
What a claimed accuracy means for a thousand patients

A product arrives with a sensitivity and a specificity. Seat a thousand patients in one room, switch it on, and see who it flags.

A seating plan of 1,000 patients. With the claims as set, 173 are flagged and 27 of those have the condition.

About one flag in six is right.

Of the patients who have the condition, the share it flags.
Of the patients who do not, the share it leaves alone.
In the room where the product will be used.

Of 1,000 patients, 30 have the condition. The product flags 173: 27 who have it and 146 who do not. It misses 3.

  • Flagged, has the condition 27
  • Flagged, does not 146
  • Has it, missed 3
  • Not flagged, does not 824

White light is a flag. Yellow is the condition. Point atTap a seat to read it.

A bright blue field of 1,000 people seen from directly above, each casting a long shadow; 173 stand in a disc of white light and 30 cast a yellow shadow, 27 of them from inside a disc of light and 3 without one.
The same room from above: 90% sensitivity and 85% specificity, with 30 of 1,000 patients affected.

The same thousand, seen from above

White light falls on everyone the product flags. A yellow shadow belongs to someone who has the condition.

Pull the stain back across this plate and the yellow all but disappears. Without the colour you cannot tell who has the condition, which is where a buyer stands when all they have is the claim.

Set the third control above to 30 in 100 and the same claim behaves like a different product. This is why we read a tool against the patients it will actually meet, before anyone adopts it.

The arithmetic: patients with the condition, multiplied by sensitivity, are flagged correctly. The remaining patients, multiplied by one minus specificity, are flagged in error. Counts are rounded to whole patients.

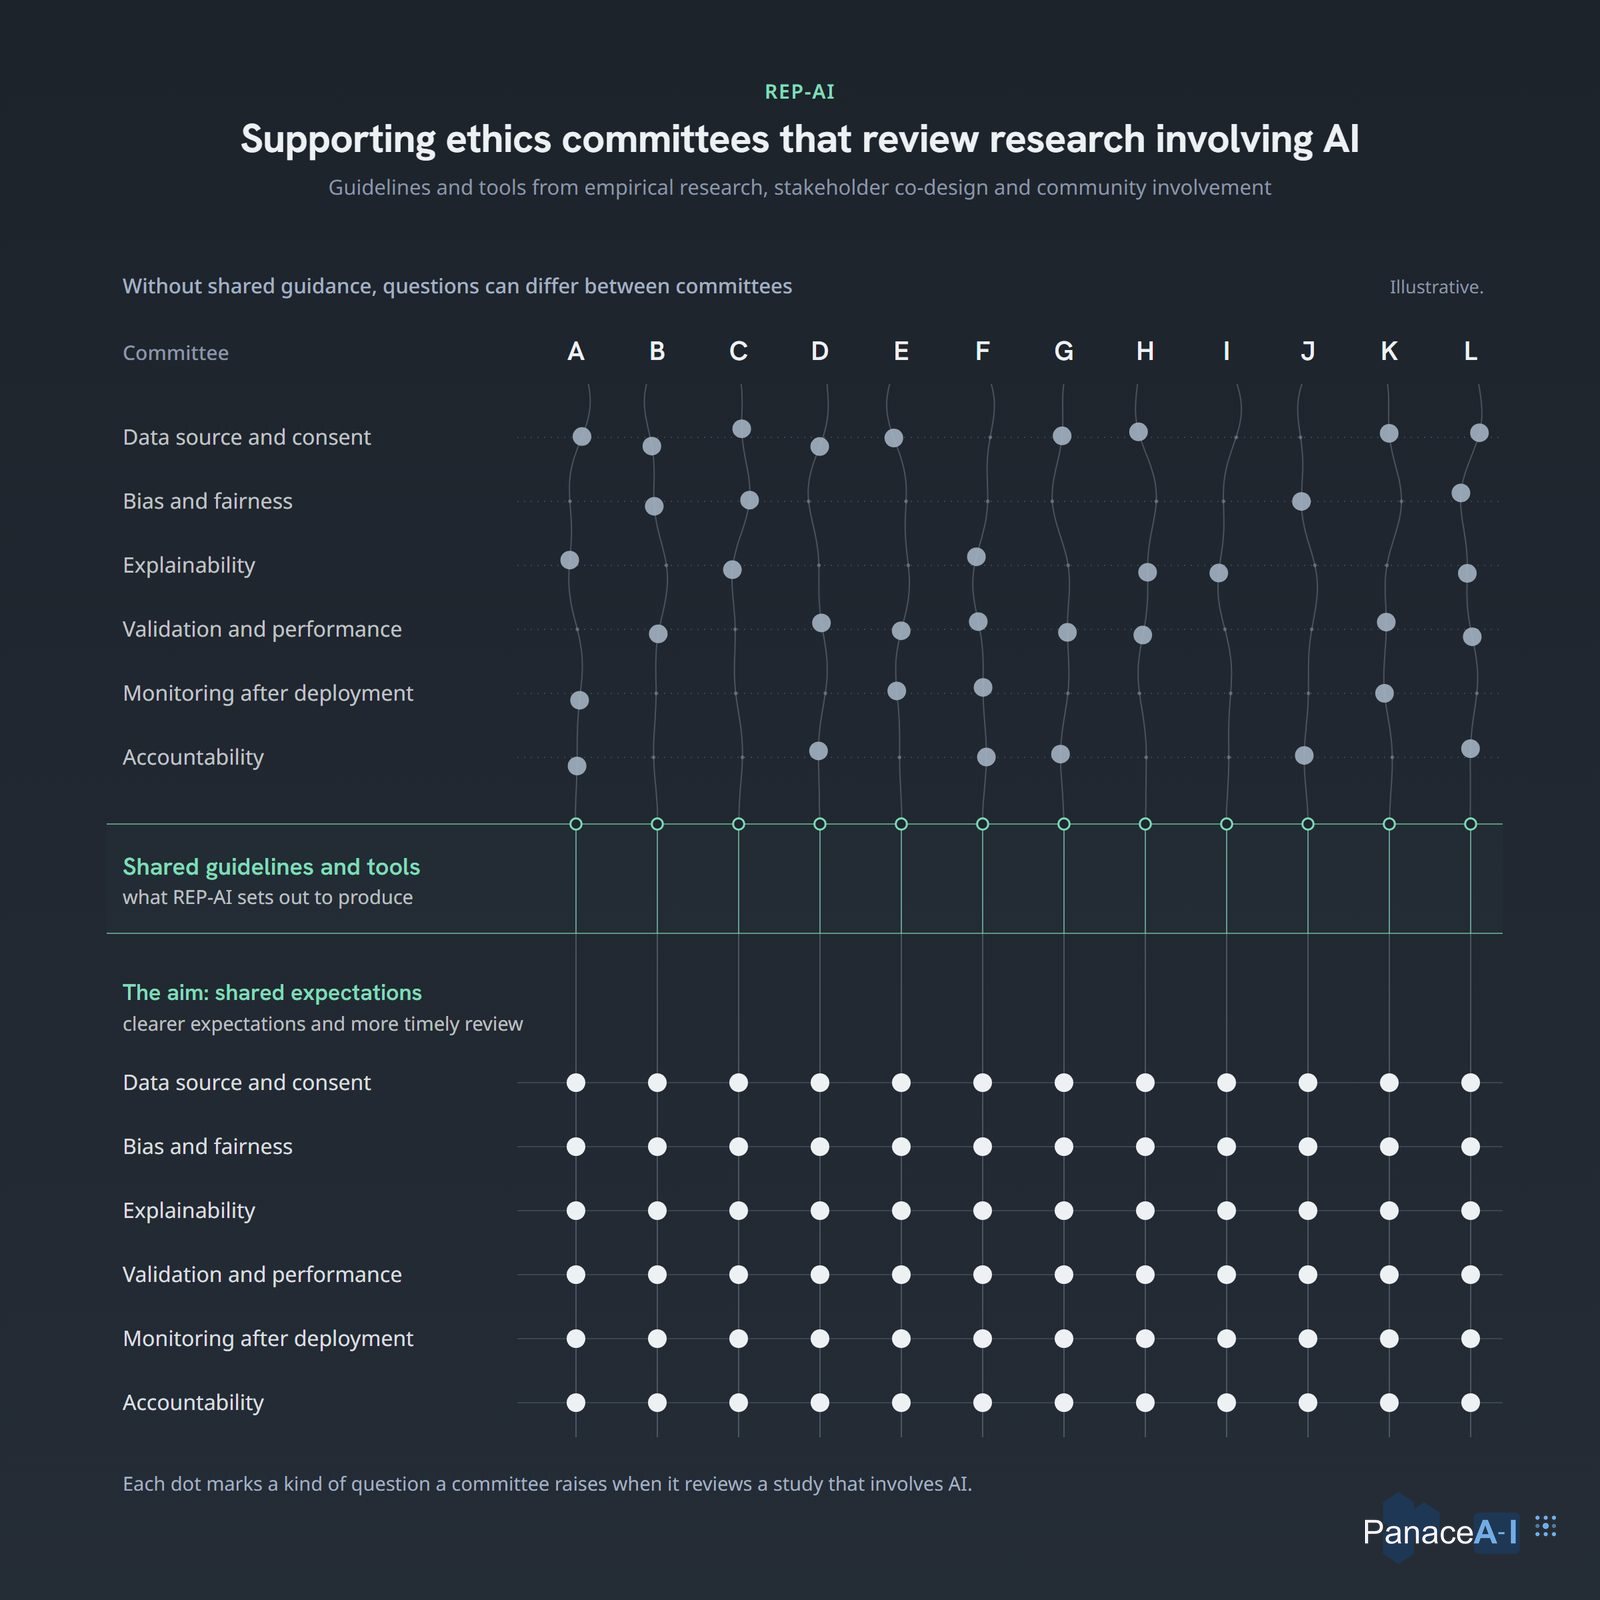
A slate plate with twelve columns for committees A to L and six rows of questions: in the upper half grey dots are scattered unevenly along wavering lines, a pale mint band crosses the middle, and in the lower half every column carries the same six white dots.
Ethics committees raising different questions about research that involves AI, and the shared expectations that REP-AI sets out to produce.

REP-AI: Research Ethics Plus-AI

A national project on the ethical review of health-AI research.

Funded by an NHMRC Partnership grant of $2.25 million, it is led by the University of Wollongong with Macquarie University and Bellberry, with NSW Health as a partner.

It is developing shared guidelines and tools for the committees that review research involving AI.

PanaceAI's founder is a Chief Investigator on the project. His work on it is independent of PanaceAI.

Part four: Data science for health and research

Analysis, modelling and data products for questions that do not fit a category: screening policy across a country, vision in elite sport, decision support for midwives.

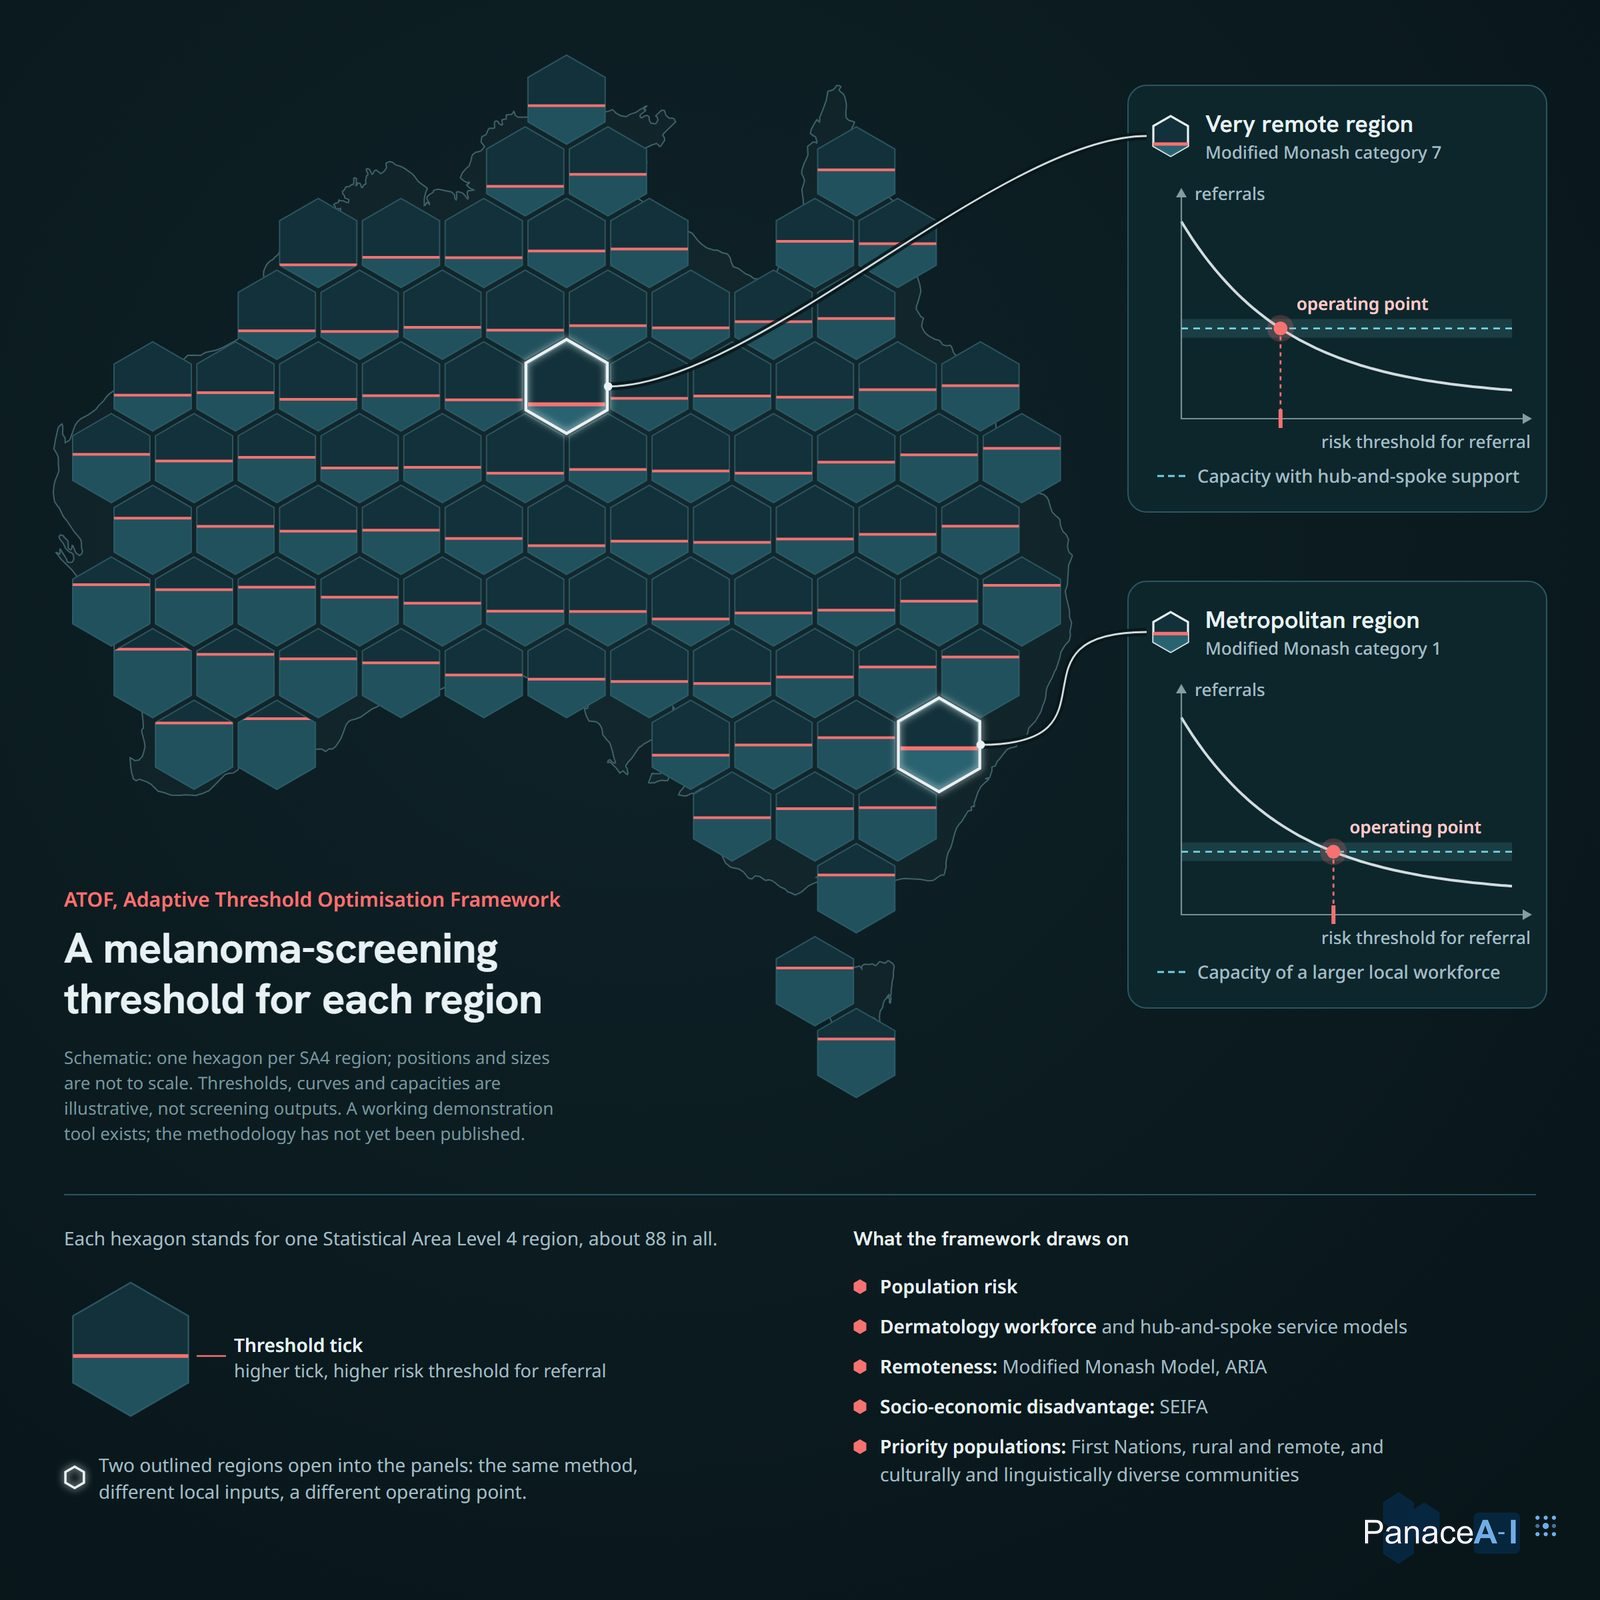
A dark teal map of Australia built from hexagons, each crossed by a short coral tick at a different height; two outlined hexagons are joined by lines to small charts at the right, one for a very remote region and one for a metropolitan region.
Australia drawn as hexagons, one for each of about 88 regions, each with its own melanoma screening threshold.

ATOF: Adaptive Threshold Optimisation Framework

Helps decide where a melanoma screening threshold should sit in each of about 88 regions of Australia, weighing population risk against the dermatology workforce and equity.

Developed at
the Daffodil Centre, a joint venture of Cancer Council NSW and the University of Sydney

The method is not yet published. PanaceAI hosts the live demonstration for the research team.

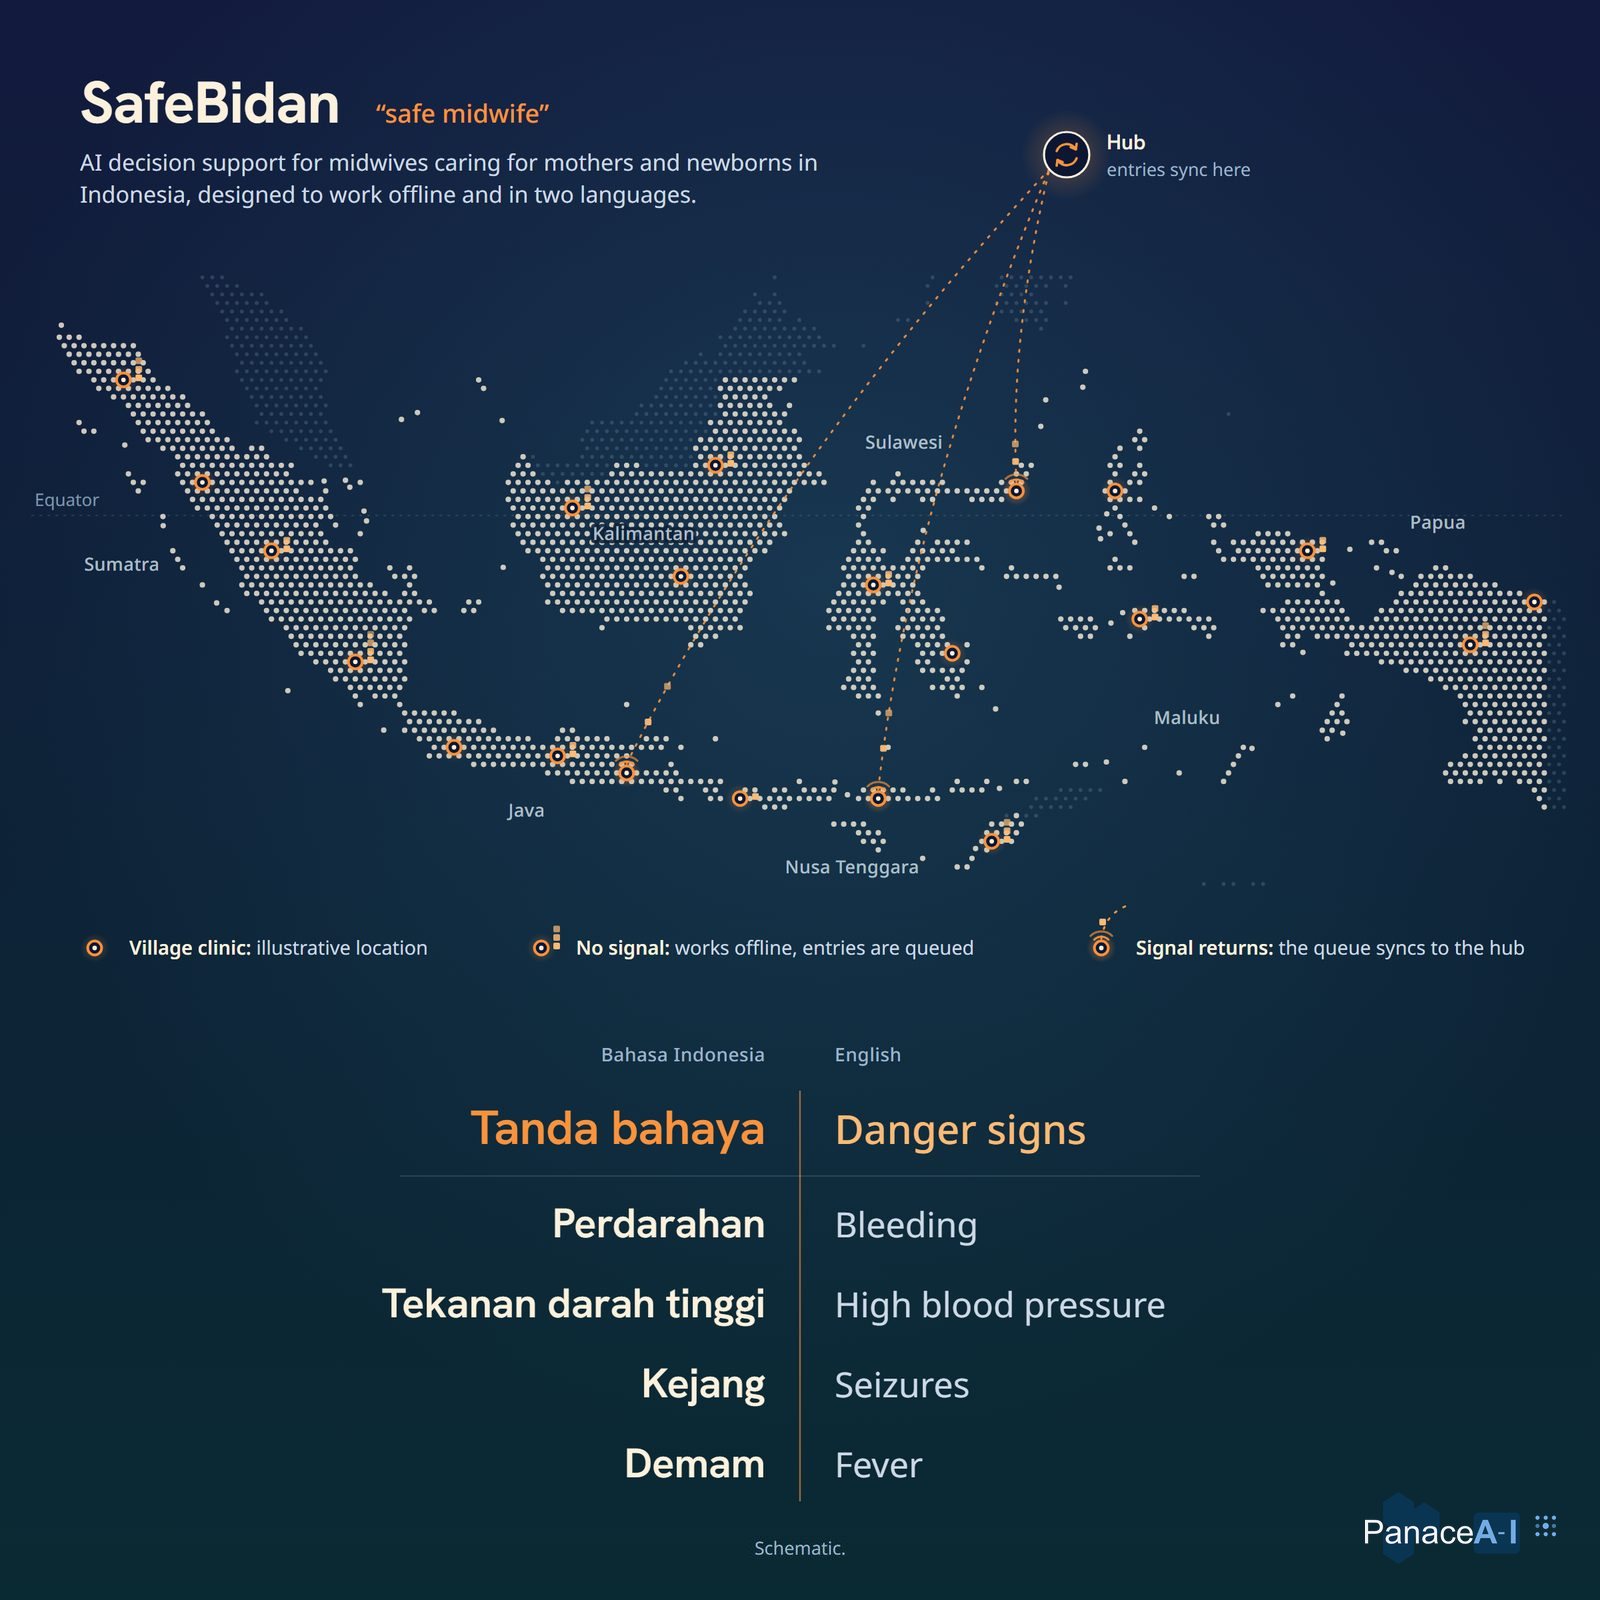
A dot map of Indonesia on a dark blue ground with small orange clinic markers, dotted lines rising from four of them to a hub, and beneath the map four danger signs set in Bahasa Indonesia and in English.
SafeBidan is meant for village clinics across the Indonesian archipelago, where the signal comes and goes. The version online today is a demonstration on synthetic data.

SafeBidan

Decision support for midwives in Indonesia, covering maternal and newborn care, in Bahasa Indonesia and English.

A rapid mode checks risk at the visit, and a fuller mode follows labour on the WHO Labour Care Guide.

  • Tanda bahayaDanger signs
  • PerdarahanBleeding
  • Tekanan darah tinggiHigh blood pressure
  • KejangSeizures
  • DemamFever
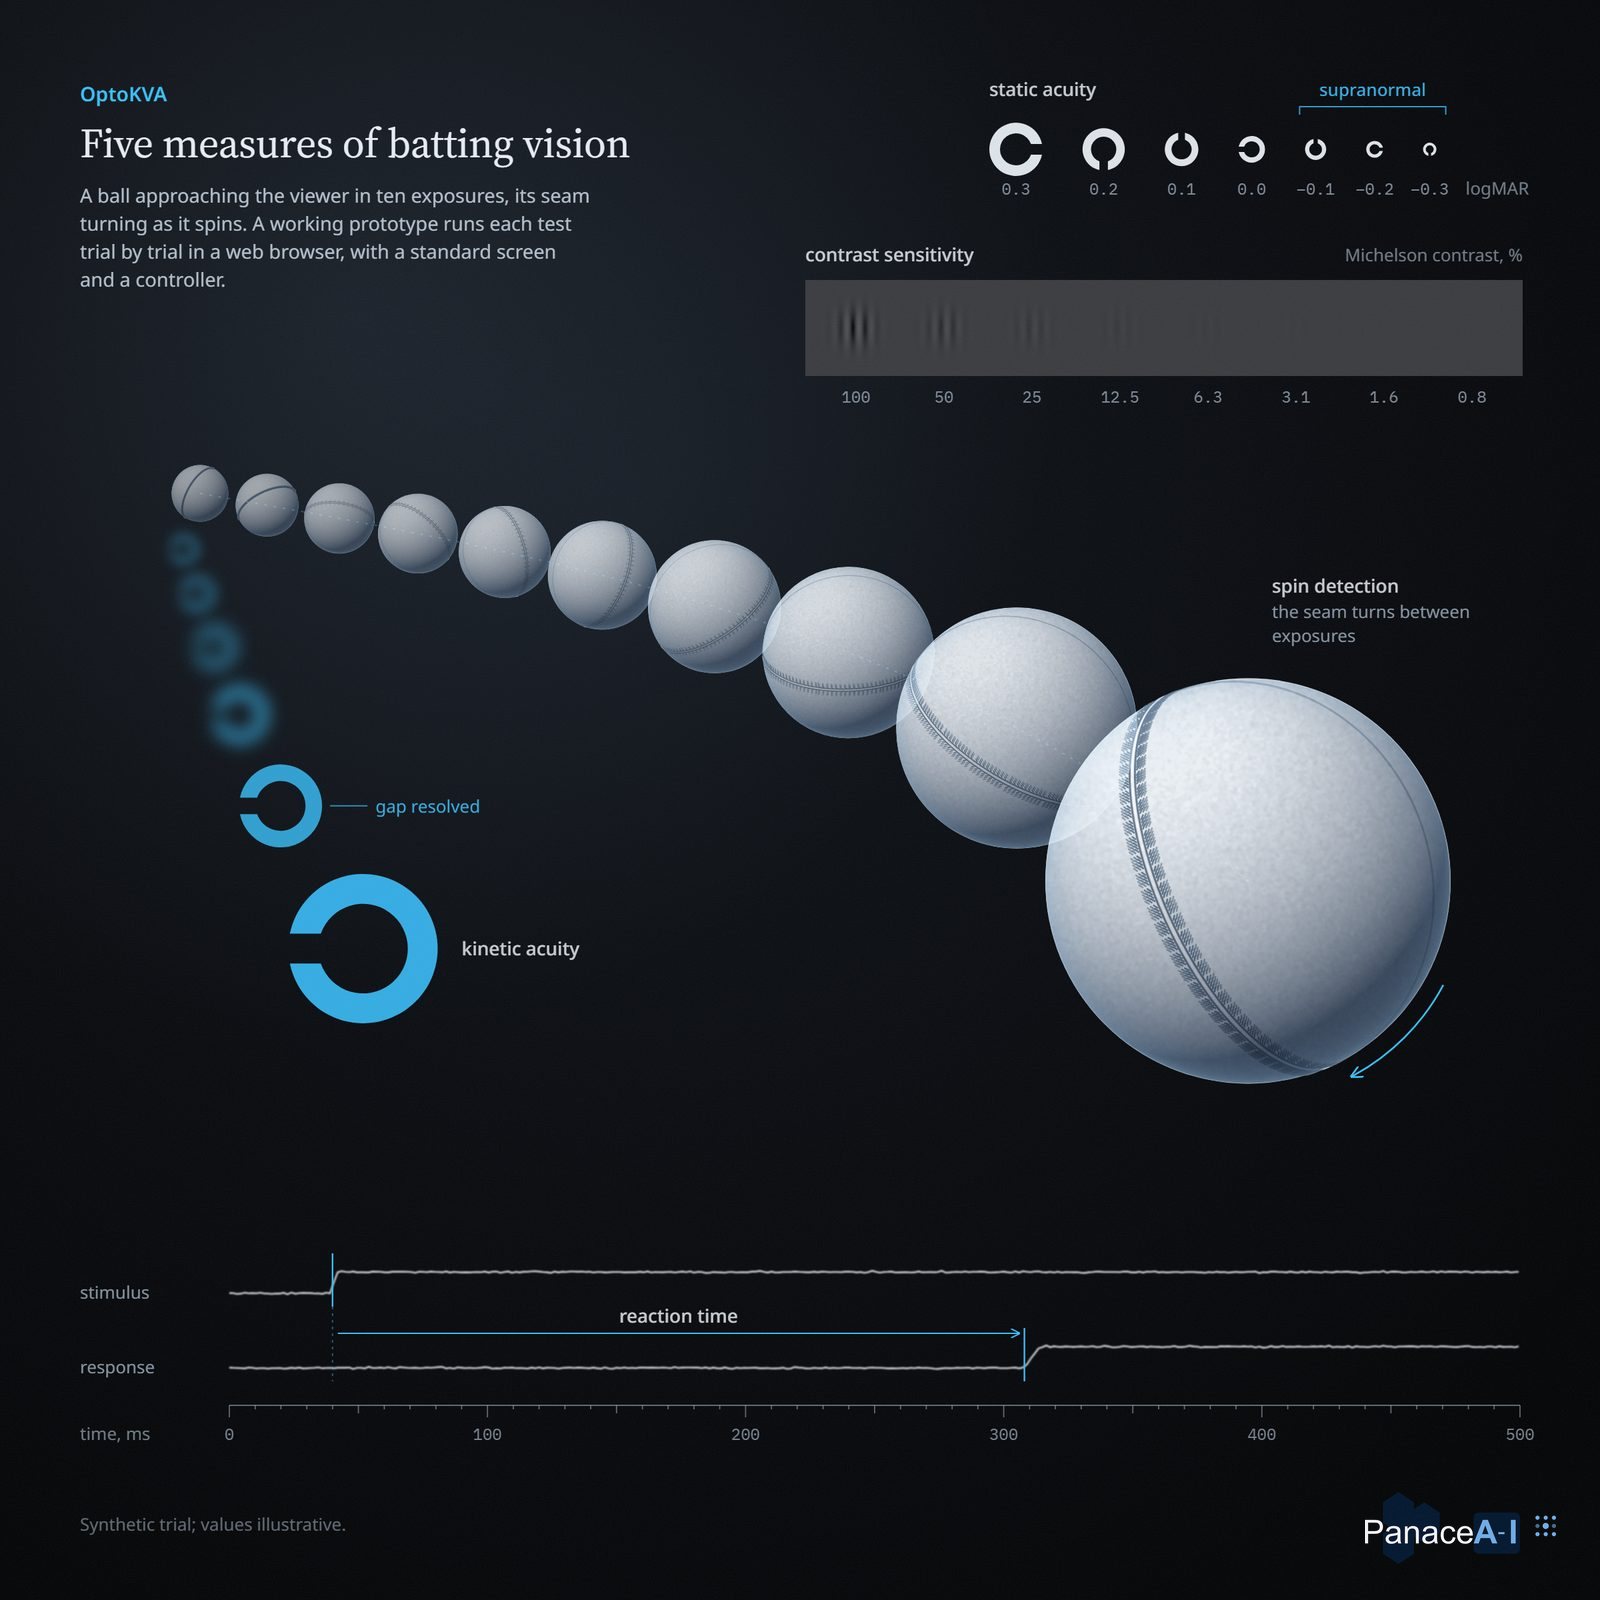
Ten pale balls in a row growing from small at the upper left to large at the lower right on a near black ground, the seam on each turned a little further; blue broken rings at the left, rows of smaller rings and a fading grating at the top, and a reaction time trace along the foot.
A ball approaching in ten exposures, its seam turning as it spins, with the measures of batting vision that OptoKVA tests.

OptoKVA

A browser-based test battery for the vision that sport demands: kinetic acuity, contrast sensitivity, spin detection and reaction time.

Built with
Acuity Intelligence
First used
in a research screening round with 31 elite cricketers, June 2026, alongside a full clinical eye examination. One dot, one cricketer.

Part five: Custom apps with AI and data features

Apps and tools designed and built to a client's need, for clinicians, patients, families, researchers or organisations, with AI and data features where they earn their place. Each app in this part runs today at its own address.

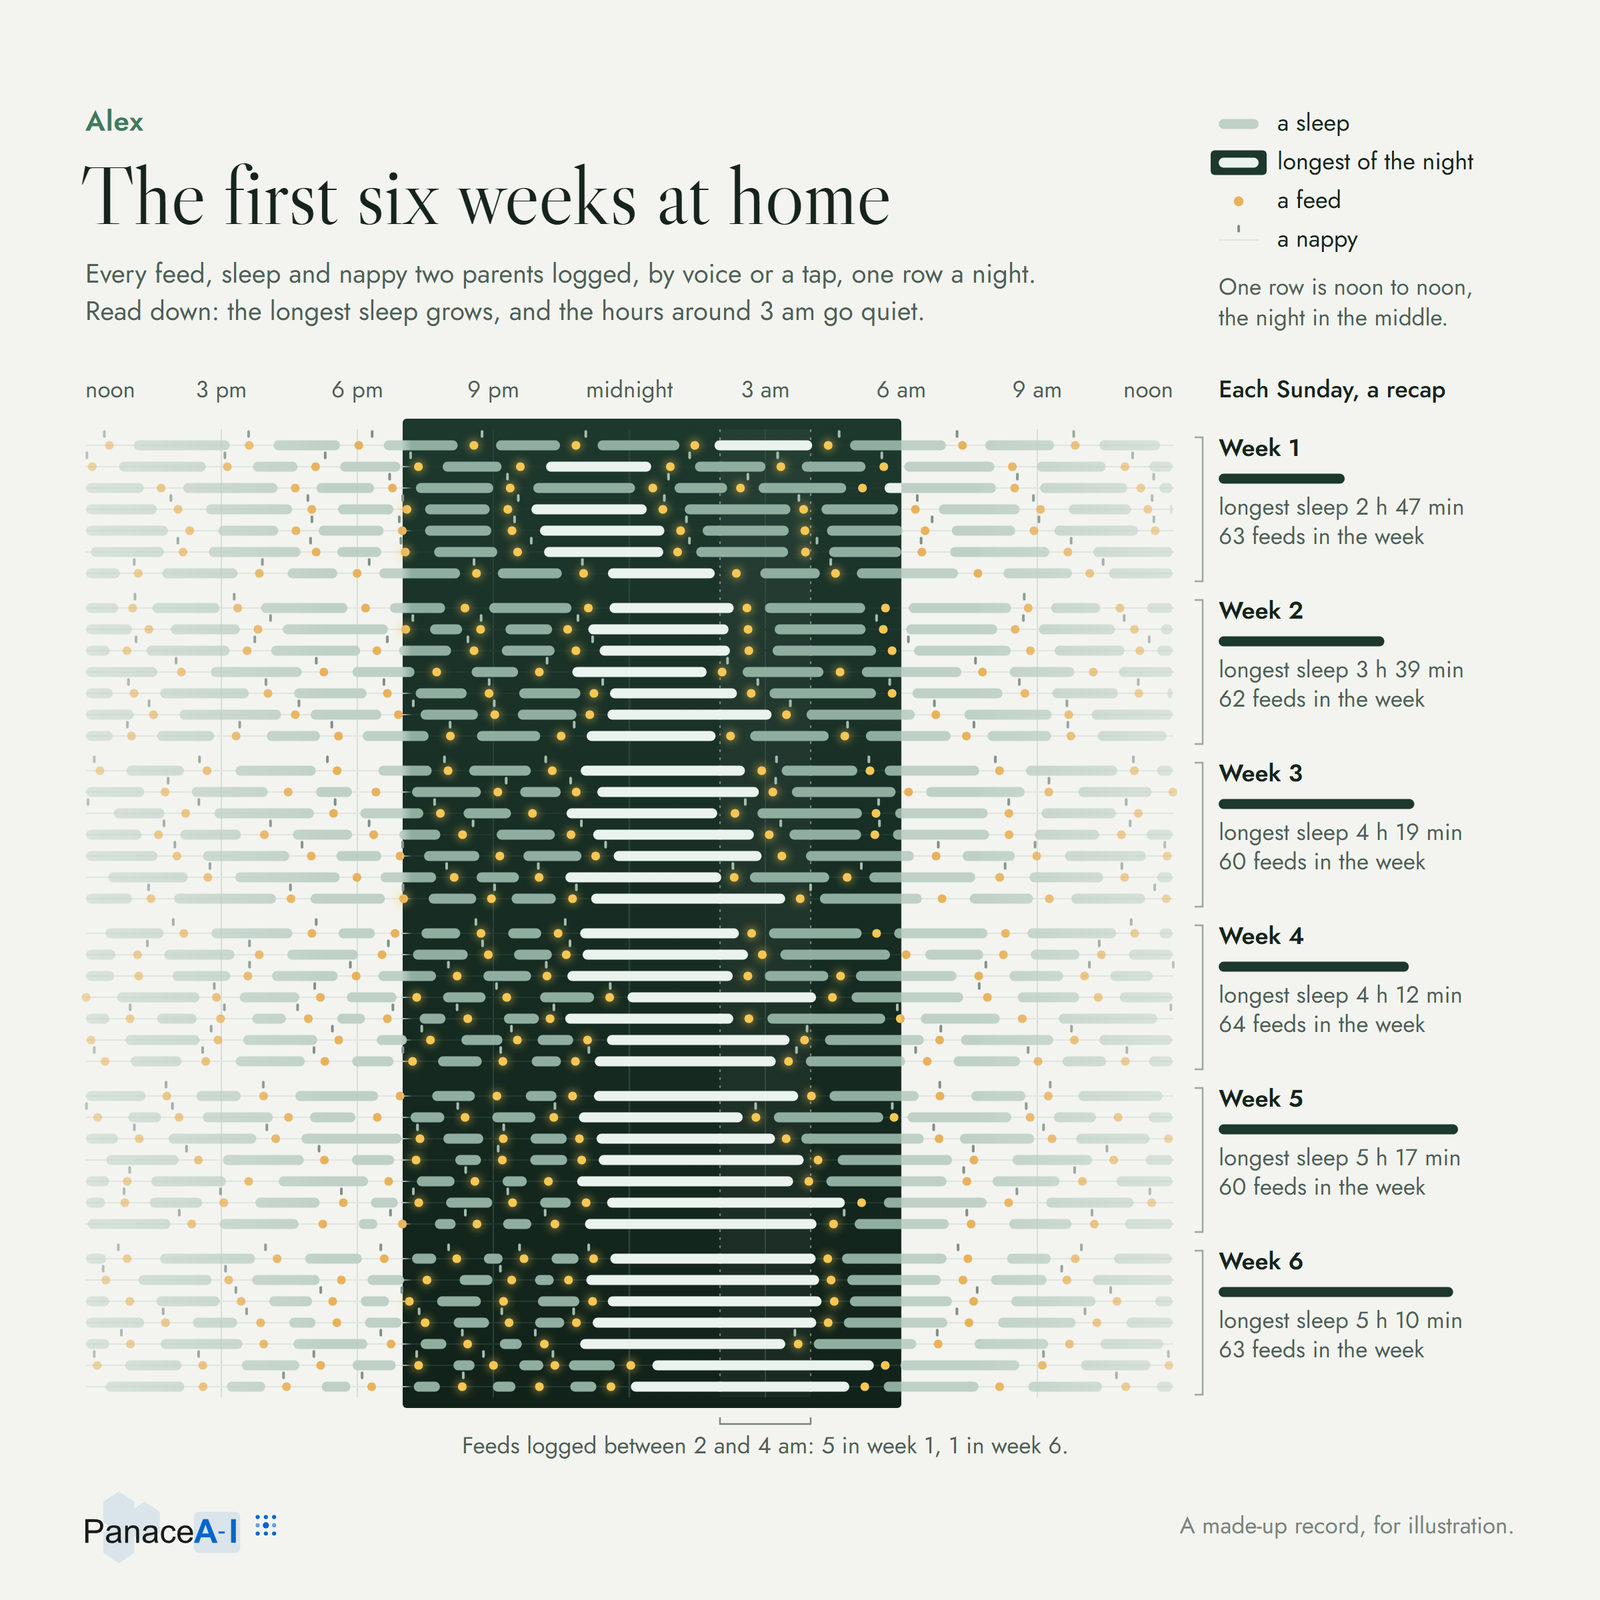
A poster on a pale sage ground: a sleep chart of 42 rows, one for each night of a baby's first six weeks at home, each row running from noon through midnight to the next noon, so that the hours from 7 pm to 6 am form a deep green column down the middle. Sleeps are pale bars, feeds are small marigold dots that glow inside the dark column, and nappies are short grey ticks. The longest sleep of each night is drawn in near white, and these bright bars widen down the column from about two and a half hours a night in the first week to nearly five in the sixth. At the right a weekly recap gives each week's longest sleep as a dark bar with its length (2 h 47 min in week 1, 5 h 10 min in week 6) and the number of feeds; under the column a note reads "Feeds logged between 2 and 4 am: 5 in week 1, 1 in week 6."
Six weeks of a made-up record kept in Alex, one row a night from noon to noon. Read down: the longest sleep grows from 2 h 47 min to more than five hours, the feeds logged between 2 and 4 am fall from five in the first week to one in the sixth, and each Sunday the week is summed up.

Alex

A private place for two parents to keep track of a new baby: feeds, sleep, nappies, milestones and photos.

A worked example of a custom app, designed and built by PanaceAI.

A parent can say what just happened and Alex turns the words into an entry, or log it with one tap. Whatever one parent logs appears on the other's phone straight away.

Each Sunday the week is summed up in a short recap, and a summary can be taken to a GP or paediatric appointment. Photos are kept in private storage that only the family can see, and a family can choose to keep them on the parent's own device instead.

Alex itself

Two of its screens, redrawn: the front page a visitor sees, and the Diary inside the app, with made-up entries.

A light web page with a rounded sage green app mark, the name Alex, the heading "A calm companion for the first 1,000 days.", a line about keeping track of a baby's feeds, sleep, nappies, milestones and photos and looking back at them together, and a green "Get started" button. A web app with a pale side panel listing Today, Insights, Diary (selected), Health, Circle and Me, and a page headed "Diary" with two buttons, "Doctor summary" and "Photos"; under "Today", with a line counting the day's feeds, sleep and nappy changes, a list of made-up entries with their times, starting with a bottle feed of 90 ml of breastmilk at 7:55 pm, a wet nappy, a breast feed on the right side for 15 minutes and a sleep of 80 minutes in the bassinet.

The front page of Alex, redrawn: a calm companion for the first 1,000 days, a private place for two parents to keep track of their baby.

Five more that run today

Five of the tools elsewhere on this page are also apps in their own right, each at its own address. Each shows something a custom build might need.

Tell us who will use the app and what it should do. A few lines are enough to start.

Describe the app you need

Worked with

Organisations in the work on this page, each in the part it played.

Built for

  • NSW HealthRAMS+ and RAMS-CT
  • Rehabilitation Medicine Society of Australia and New ZealandResearch Activity Dashboard

Centres and collaborators

  • Northern Sydney Local Health District, NSW GovernmentRoyal North Shore HospitalMTCx, mesothelioma
  • Memorial Sloan Kettering Cancer CenterMTCx
  • Brigham and Women's HospitalMTCx
  • Gustave RoussyMTCx
  • University of BolognaUniversity of BolognaMTCx
  • Emory UniversityMTCx, the independent test
  • The Daffodil Centre, a joint venture of Cancer Council NSW and the University of SydneyATOF
  • The Centenary InstituteHome of the founder's laboratory
  • Acuity IntelligenceMyopiAI, OptoKVA

Supported by

  • Australia's Economic Accelerator, Australian GovernmentAEA Ignite grant

PanaceAI's products are being commercialised with the support of an AEA Ignite grant of $944,921. REP-AI is funded by an NHMRC Partnership grant of $2.25 million. The clinical work is published in Histopathology, Pathology and ANZ Journal of Surgery.

The practice

We build it, test it, publish it, and leave it open to be checked.

For a clinical tool that means an independent test and a paper. For a research platform it means showing how each match was made, and letting people report a wrong match in their own record.

We are based in Sydney and work with health services and hospitals, government agencies, medical colleges and societies, research institutes and universities, funders, health technology companies, and consulting firms that need a specialist.

You might have a research portfolio that nobody can see whole, a dataset and a clinical question, or a product someone else has built and a decision to make about it. Any of these is a good place to start.

PanaceAI was founded by Dr Yagiz Aksoy, a clinician scientist. He heads the Aksoy Laboratory for Clinical and Translational AI at the Centenary Institute and held senior research policy roles at the NSW Ministry of Health from 2018 to 2024.

Tell us what you are working on.

Work like this starts with a conversation, and usually more than one. Write with the question as it stands, however early it is. We will read it properly, reply ourselves, and find a time to talk.

info@panaceai.com.au
Sydney, Australia

Or write to us here

What it is about

Your question and an email address are all we need.

Please leave out any patient details. We use what you send only to reply to you (privacy notice (opens in a new tab)).

Ask us a question

Write a few lines about what you need, however early it is, and we will reply ourselves.

What it is about

Your question and an email address are all we need.

Please leave out any patient details. We use what you send only to reply to you (privacy notice (opens in a new tab)).

Or write to us directly

info@panaceai.com.au